Original Article - DOI:10.33594/000000533
Accepted 10 June 2022 - Published online 29 June 2022
1Department of Biological Sciences, Kent State University, Kent, OH, USA;
2Institute for Molecular Medicine, MSH Medical School Hamburg, Hamburg, Germany
Background/Aims: The permeability of the plasma membrane for some substances increases during osmotic swelling of the cell. Transport systems for cationic dyes were identified previously, but the hypotonic uptake of anionic substances remained elusive. We aimed to test for the hypotonic uptake of the anionic dye fluorescein and to identify the transport pathway. Methods: We quantified the uptake of fluorescein in hypoosmotic medium by fluorescence microscopy in several cell lines. To investigate the uptake mechanism, we used pharmacological inhibitors for the volume-regulated anion channel VRAC and a genome-edited cell line lacking the essential LRRC8A VRAC subunit. Results: Fluorescein was specifically taken up under hypotonic conditions in HeLa, MDCK, and 3T3 cells. Both pharmacological inhibition and genetic disruption of VRAC strongly diminished hypotonicity-driven dye uptake. Conclusion: Cellular uptake of fluorescein is mediated by the volume-regulated anion channel VRAC. The measurement of fluorescein accumulation can be used as a convenient method to detect and study VRAC activation.
It is crucial for animal cells to have compensatory mechanisms in order to counteract changes in their volume due to osmotic alterations. Regulatory volume decrease (RVD) occurs when cells undergo osmotic swelling caused by extracellular hypoosmolarity or intracellular hyperosmolarity. During RVD, the activation of swelling-activated ion channels results in the efflux of ions and osmolytes followed by water, which enables cells to adjust their volume [1, 2]. Cells may also exhibit isosmotic volume decrease in various physiological processes, such as the apoptotic volume decrease (AVD) in programmed cell death [3-5].
Volume-regulated anion channels (VRACs) play a critical role in both RVD and AVD by mediating the release of chloride and organic osmolytes [6]. VRACs are formed by hetero-hexameric complexes of LRRC8 (leucine-rich repeat containing protein 8) family of proteins (LRRC8A-E), with LRRC8A as the essential subunit [7-11]. VRACs exhibit an outward rectification with a relative anion permeability sequence that corresponds to Eisenman’s sequence I with I− > NO3− > Br− > Cl− > F− [11-13]. In addition to inorganic anions, VRACs can also conduct a wide range of organic osmolytes [7, 8, 14-17]. The subunit composition, i.e. which of the LRRC8 proteins combines with LRRC8A, determines the differential permeability for taurine, excitatory amino acids, adenosine nucleotides, or glutathione [18-23]. Besides such endogenous substrates, VRACs have also been shown to mediate the cellular uptake of various compounds, such as the antibiotic blasticidin S and the cytostatic cisplatin [18, 24].
We have previously observed that membrane blebbing stimulated by treatment with apoptosis-inducing agents, such as actinomycin D, is accompanied by a temporary increase in cellular volume. Under these conditions, cells become more permeable to cationic dyes that can enter through organic cation transporters [25]. In the present study, we tested for the cellular uptake of anionic dyes upon osmotic cell swelling. We found that in hypoosmotic media, different cell types take up fluorescein, an organic dye used in a wide range of applications in medicine and science. Fluorescein was provided in the form of sodium salt (NaFl). We tested whether fluorescein uptake is mediated by VRACs. To do that, we used pharmacological inhibitors of these channels or cells deficient in the essential VRAC subunit, LRRC8A. Together, our data indicate a significant role for VRACs in the uptake of fluorescein. The simplicity and low cost of this assay make it a promising tool for the detection of VRAC activation.
Wild-type HeLa, 3T3, and MDCK cells were obtained from ATCC (Manassas, VA). CRISPR/Cas9- generated LRRC8A-deficient 3T3 cells have been described earlier [26]. Cells were grown in Dulbecco’s Modified Eagle Medium (DMEM, 340 mosm/kg according to the manufacturer’s data) with 10% fetal bovine serum and antibiotics on loose coverslips or in coverslip-bottom dishes, either home-made or commercial (MatTek, Bratislava, Slovak Republic). Sodium fluorescein (NaFl: Sigma-Aldrich, St. Louis, MO; Carl Roth, Karlsruhe, Germany) was introduced at room temperature or at 37°C (for Fig. 5) for 10 min as 0.1 mM solution in isosmotic 100% DMEM or in hypoosmotic 50% DMEM prepared by a 1:1 dilution of DMEM with deionized water. To inhibit VRAC, cells were preincubated either with 100 μM carbenoxolone (CBX; Sigma-Aldrich, Taufkirchen, Germany) or 50 μM DCPIB (Bio-Techne, Wiesbaden, Germany) for 10 min before the addition of NaFl; the inhibitors continued to be present during the incubation with NaFl. Accumulation of NaFl was assessed by three methods.
(1) After 10 min of incubation with NaFl, cells were washed and quickly imaged in phenol red-free DMEM. Images were acquired with a Leica Thunder imaging system using a PL APO 20x/0.80 objective (Leica, Wetzlar, Germany). 140-170 cells per condition obtained from 4 independent experiments were analyzed. The total cell-associated intensity was obtained by subtracting the background value determined in the vicinity of each cell. The mean value for each condition per experiment was used for the final quantification. Statistical significance was tested using Prism9 software (GraphPad, San Diego, CA) and analyzed by one-way ANOVA. All data are presented as the mean ±SD.
(2) Cells were grown on loose coverslips in 35 mm dishes. The coverslips were removed and affixed to glass slides over small spots of silicone grease, with cells facing the slide. Next, DMEM was replaced with 50% DMEM by adding it from one side of the coverslip and removing it from the opposite side by gently touching the edge of the glass with filter paper. In some experiments, 0.1 mM NaFl was added following a 30- or 60-min preincubation in NaFl-free 50% DMEM. In control experiments, NaFl was added in 100% DMEM for 10 min. To terminate NaFl accumulation, the solution under the coverslip was replaced after 10 min with 7 mg/ml Acid Blue 9 (AB9; TCI America, Portland, OR) prepared in the same (i.e., 50% or 100% DMEM) NaFl-free media. The samples were imaged within 10 min on an Olympus IX81 microscope using a 20x/0.7 objective. Each field was imaged twice: in fluorescence, using the standard FITC filters, and in transmission through a 630/10 bandpass filter for the determination of cell volume (see below). The purpose of this observation was to quantify the intracellular concentration of NaFl in molar units.
(3) Observation was done in real-time on a laser scanning confocal microscope, Olympus FV1000; the purpose of these experiments was to assess the dynamics of NaFl accumulation and NaFl loss upon its removal from the external solution.NaFl intake was observed in HeLa cells grown in coverslip-bottom dishes. Since the brightness of the medium far exceeded that inside the cells, a high-power objective (oil-immersion 60x/1.4) was used, which provides the best depth discrimination. The objective was focused on central cross-sections of cells, where fluorescence was almost unaffected by the surroundings; at t=0, 0.1 mM NaFl in 50% DMEM was added. The observation continued at specified intervals for 15 min. Photobleaching was estimated at 0.14% per scan, and thus was insignificant for the small number of time points used in our experiments.The retention of NaFl was tested in cells positioned between a coverslip and a slide as described above because such a configuration allowed for much more rapid medium replacement. HeLa cells were incubated for 10 min in 50% DMEM with 0.1 mM NaFl, after which the medium was quickly replaced with NaFl-free 50% DMEM, and the observation was started.
Quantification of wide-field fluorescenceFluorescence was quantified using a previously described approach [27, 28]. In the first step, the microscope was calibrated with a solution of 10 μM NaFl in PBS containing an additional 7 mg/ml AB9 to stabilize fluorescence [29]. A small drop of this solution was placed on a glass slide, and a half-ball lens with radius R 5 mm (Edmund Optics, Barrington, NJ) was immersed in it, forming a variable-depth fluorescent layer between the bottom of the lens and the flat surface of the slide. An image of such a sample was captured with a 10x/0.4 objective, and the intensity distribution was fit to a linear regression as
where z is the depth of the liquid at a distance d from the touchpoint:
The values of β obtained in three experiments were 63.1 μm-1, 63.3 μm-1, and 62.2 μm-1. To avoid repeating this lens-based calibration every time, we used it to characterize the highly reproducible brightness of concentrated 30% NaFl (the same concentrated standard was used to correct all fluorescence images for uniformity, including the very image of an immersed lens). At such a high concentration, fluorescein is stable under illumination, and the depth of the liquid becomes irrelevant because the excitation light does not penetrate beyond a submicrometer depth [30]. Because fluorescein exhibits self-quenching, the standard is not particularly bright, and it was characterized in terms of the equivalent surface density Nst of dilute NaFl:
Now the average fluorescein concentration inside a given cell can be expressed by comparing it with the standard slide as:
where Ist is the average intensity of the concentrated standard in grayscale units, It is the total cell-associated intensity, and V is the cell volume determined by AB9 exclusion (see below).
Cell volume measurementsCell volumes were measured by transmission-through-dye (TTD) imaging [29, 31, 32]. The samples containing AB9 were imaged in transmission through a 630 nm bandpass filter (Andover, Salem, NH). AB9 at 7 mg/ml strongly absorbs at these wavelengths, creating a relatively dark background; however, intact cells exclude AB9 and appear brighter in transmission in direct relationship to their height hcell. Cell volume is calculated as,
where A is the cell area and α is the absorbance of the AB9 solution determined by a lens immersion method similar to the above-described fluorescence calibration [29, 32, 33]. In some samples, the background was uneven across the field due to a small tilt of the coverslip. To simplify the analysis of the entire field, background correction was implemented using the ImageJ Fit Polynomial plugin. Further details of cell volume measurement can be found elsewhere [29, 31, 32].
To test for fluorescein uptake during osmotic swelling, we treated various cell lines, HeLa, MDCK and 3T3, with hypoosmotic medium (50% diluted DMEM) in the presence of sodium fluorescein (NaFl) for 10 min. Fluorescence imaging revealed brighter fluorescence in cells exposed to NaFl in 50% DMEM compared to 100% DMEM (Fig. 1).
When we quantified the intracellular NaFl concentrations, we consistently observed a significant increase in intracellular NaFl in 50% DMEM over a 100% DMEM control, namely a 7.5-fold average increase for 3T3 and 3-3.5-fold increase for HeLa and MDCK cells (Table 1). This enhanced accumulation was limited to early times following hypoosmotic shock: preincubation in hypoosmotic 50% DMEM for 30 min or longer before the application of NaFl brought intracellular NaFl accumulation down to control levels, or even below control in HeLa cells (Table 1). Since cell volumes completely recover by 30 min through regulated volume decrease (Fig. 2), the increased membrane permeability to NaFl clearly correlates with cell swelling.
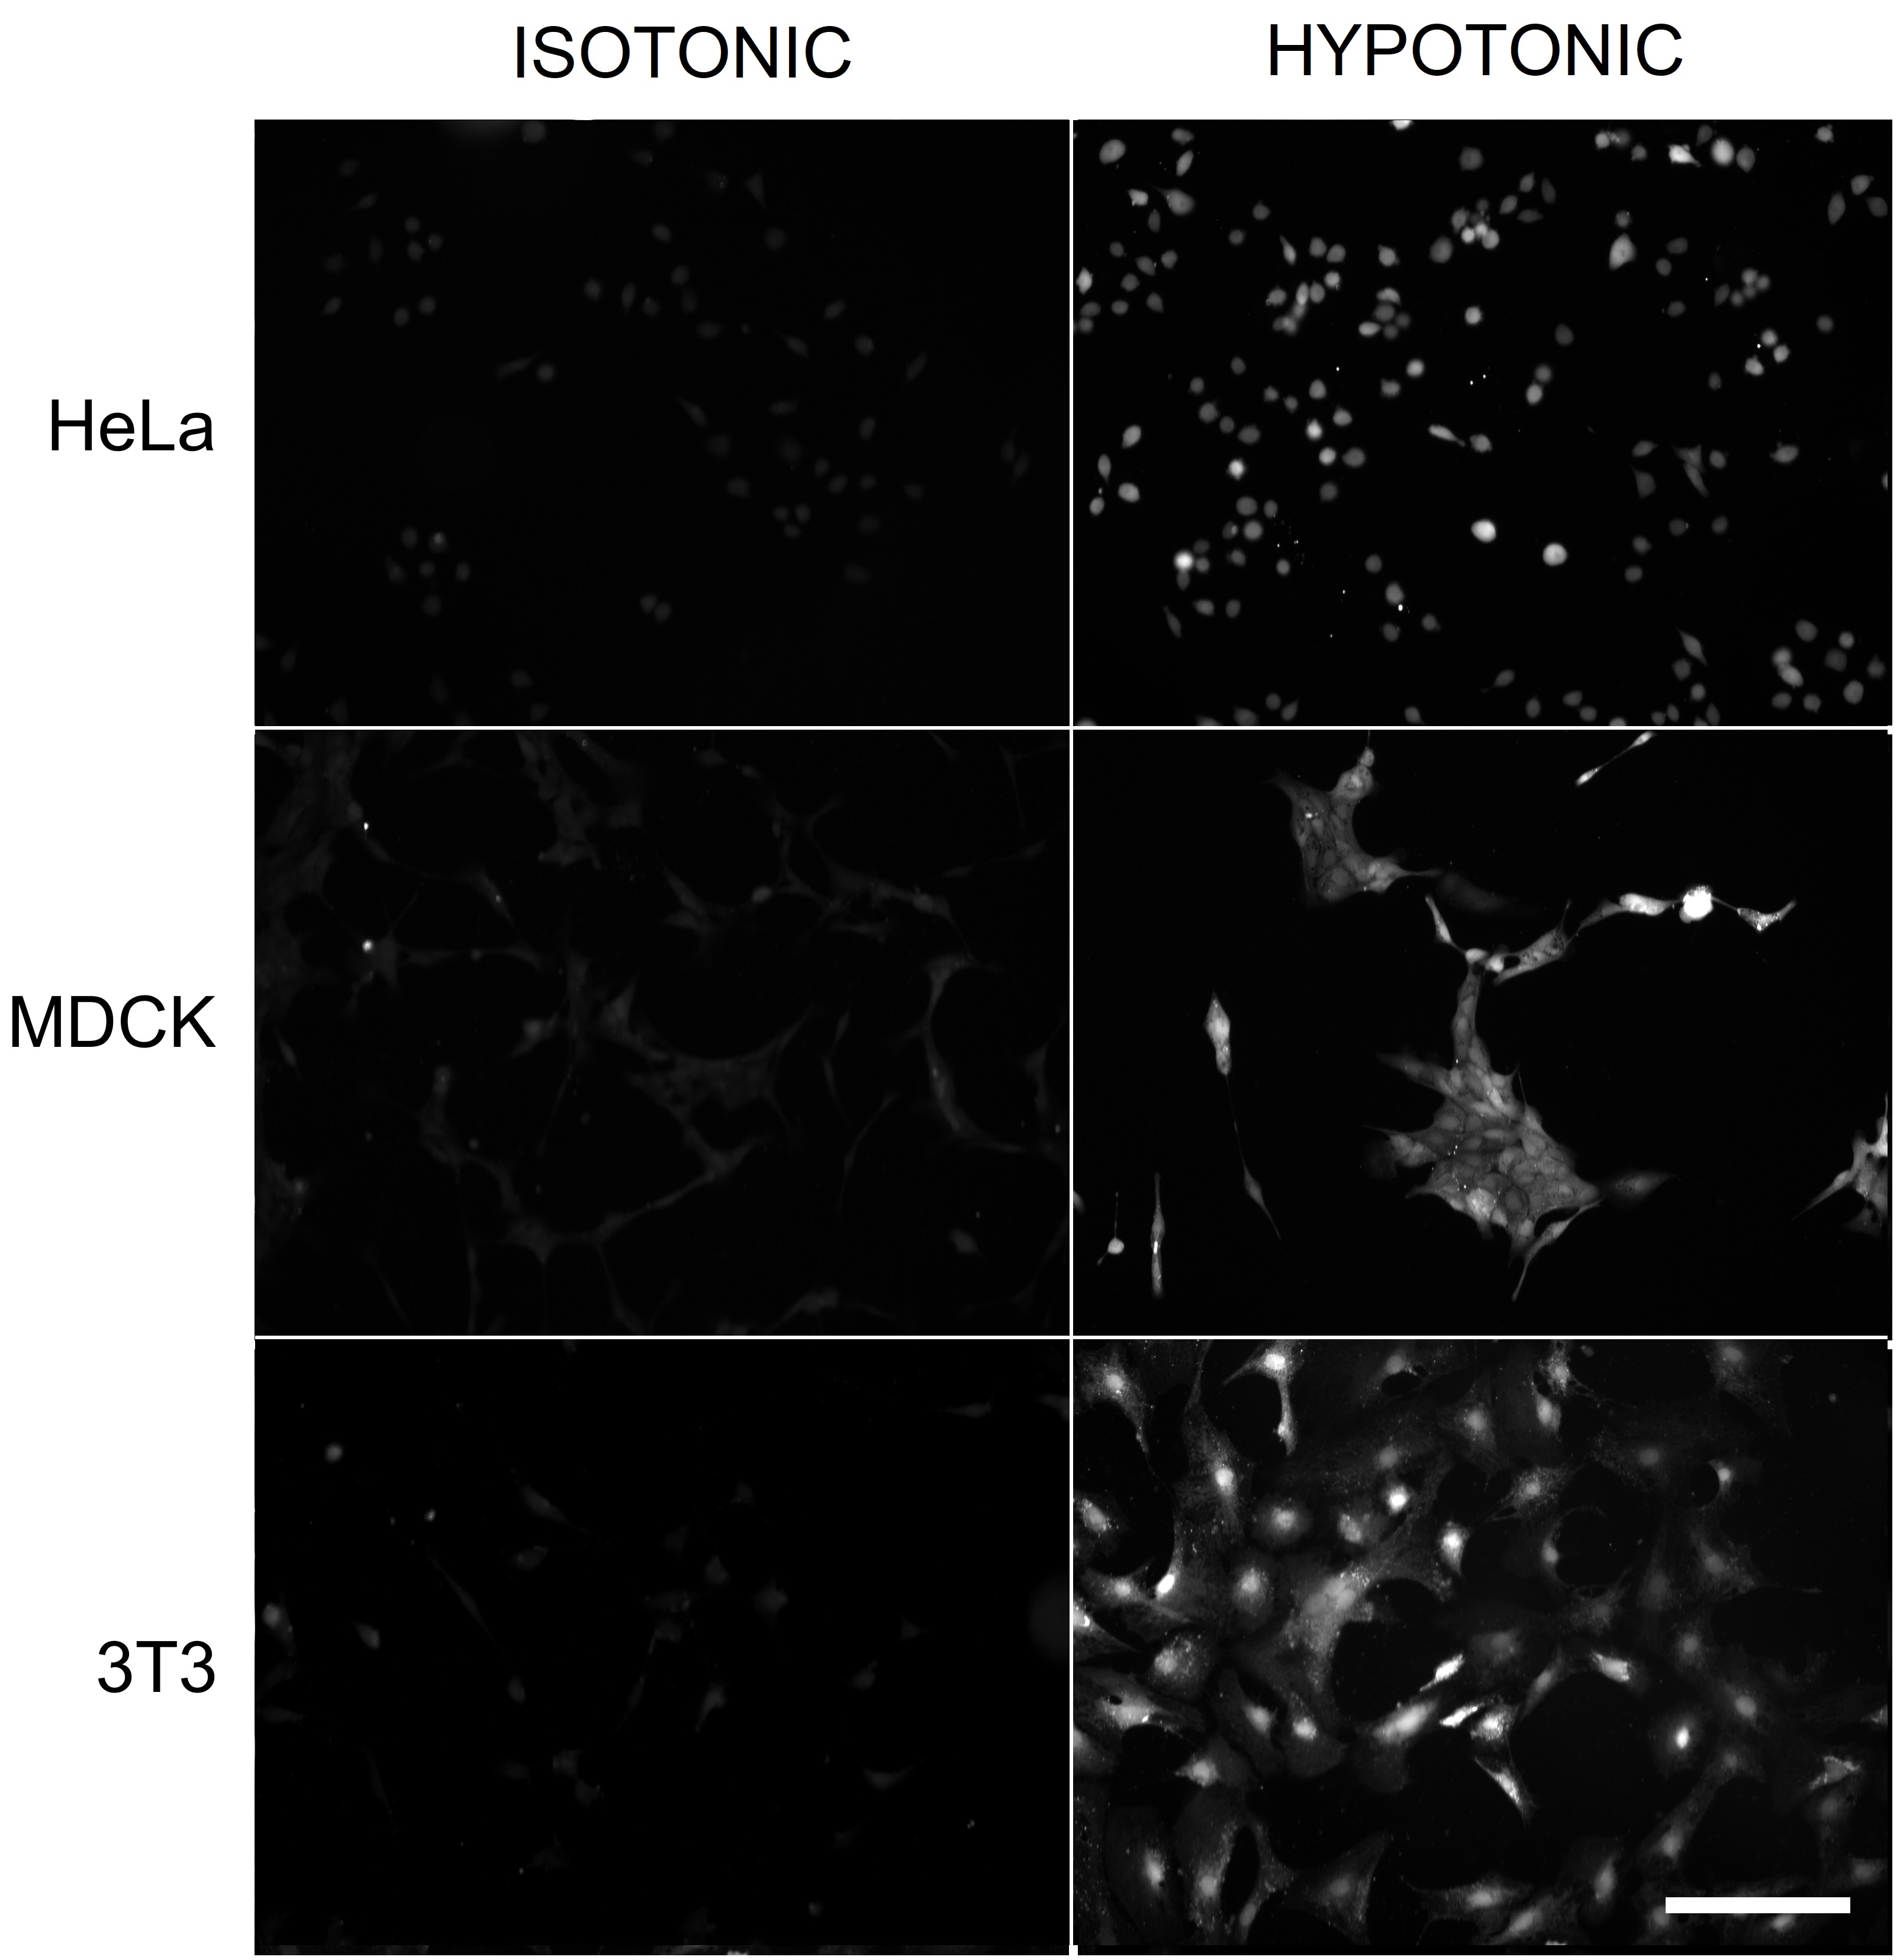
Fig. 1. Fluorescence images of HeLa, MDCK, and 3T3 cells exposed to 0.1 mM NaFl in isotonic 100% DMEM or hypotonic 50% DMEM. After a 10-min incubation, NaFl was removed, and the cells were imaged as described in Methods. The cells in hypotonic and isotonic conditions were imaged at the same exposure and displayed using identical settings for a 12-to-8 bit conversion. Scale bar, 200 μm.
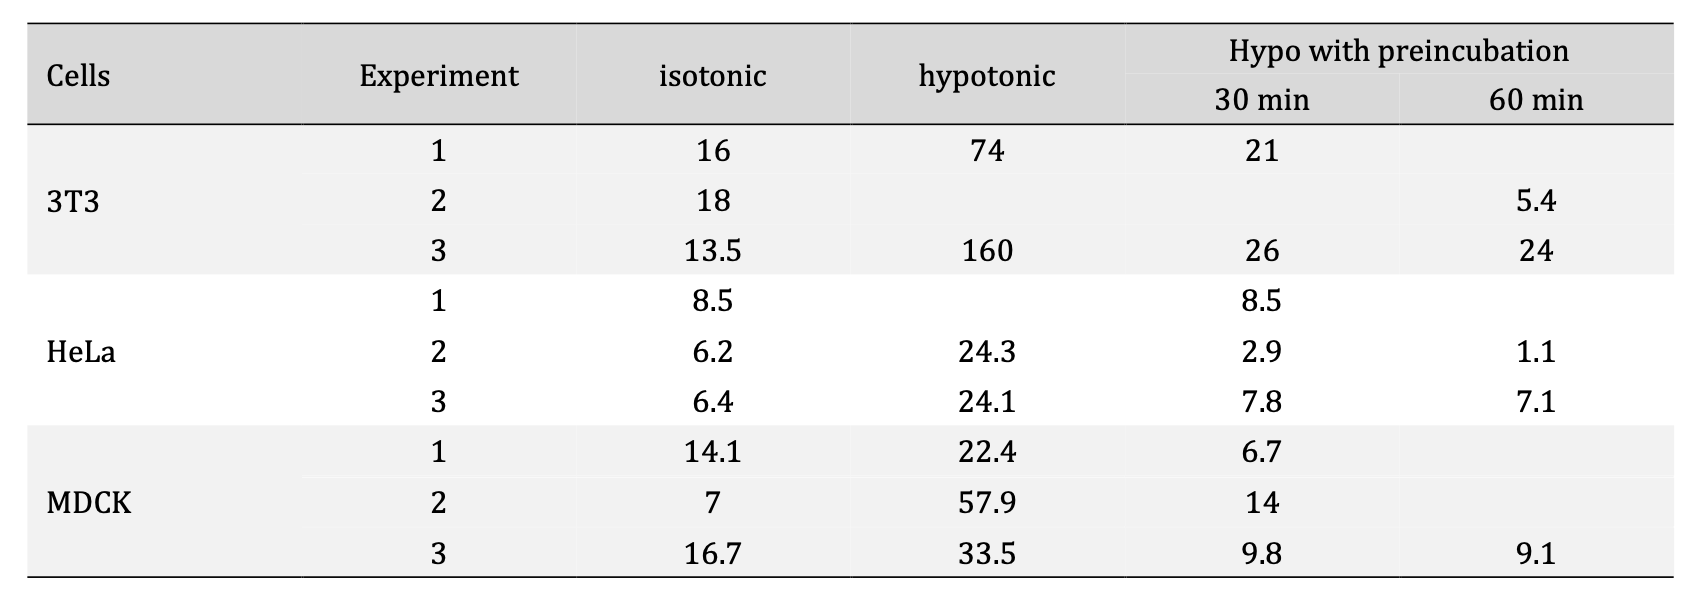
Table 1. Intracellular concentration of NaFl (μM) after a 10-min incubation with 266 μM NaFl under various conditions: in isotonic medium (100% DMEM), under hypotonic shock (50% DMEM) or in hypotonic medium, but with a 30-min or 60-min preincubation in hypotonic medium. The increase in NaFl accumulation under hypotonic conditions (without preincubation) compared to isotonic control was significant (p< 0.05 by Student’s t-test)
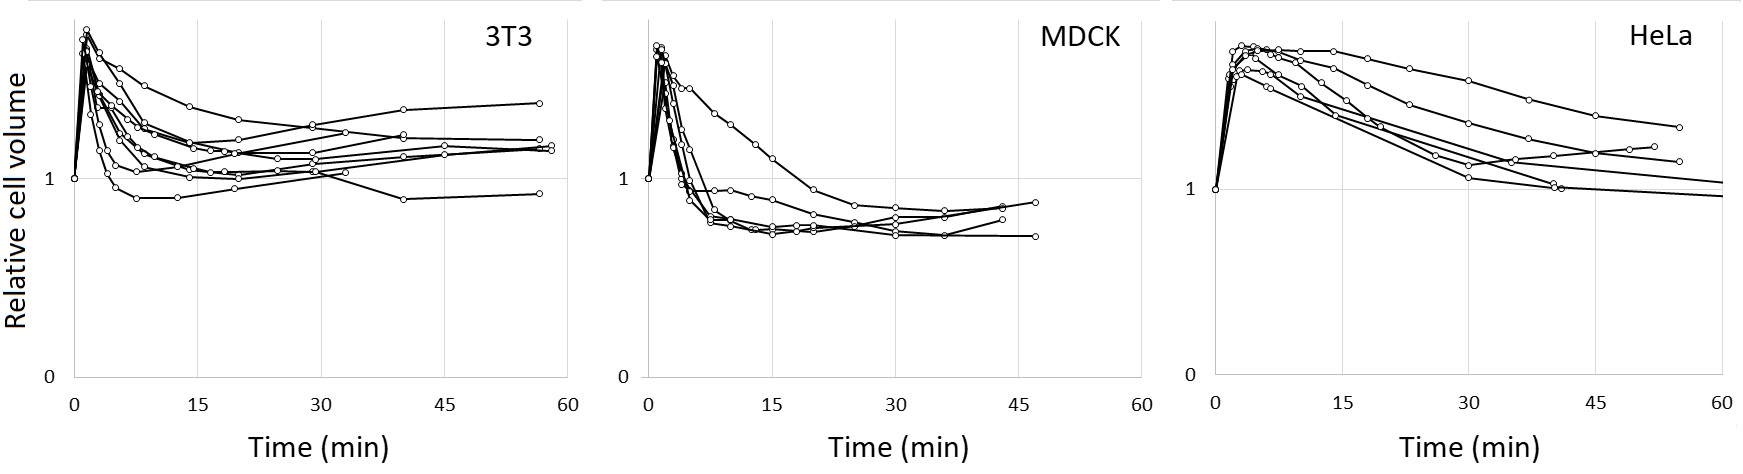
Fig. 2. Cell volume dynamics following hypotonic shock in 50% DMEM. Coverslip-attached cells were mounted on slides in isotonic DMEM containing AB9; at t=0, the medium was replaced with 50% DMEM/AB9, and the observations of the same cells were repeated at specified intervals. Cell volumes relative to that in isotonic DMEM are plotted against time. Representative traces of individual cells from three independent experiments are shown.
We have also addressed the possible concern that intracellular NaFl is partly quenched by proteins, so that the increase in fluorescence in a hypoosmotic solution may reflect dequenching at reduced protein density [34, 35]. Thus, MDCK were preloaded with NaFl in hypoosmotic 50% DMEM, then washed and returned to 100% DMEM for 30 min (by which time their volume returns to normal; Fig. 2). The first set of images (TTD and fluorescence) was then collected, after which the cells were re-exposed to 50% DMEM. After 5 minutes, their volumes and fluorescence were measured again. If cell swelling caused dequenching, one would expect an increase in fluorescence; in reality, despite a 40% volume increase, fluorescence was reduced by 11% (± 0.05 SD) based on the analysis of four groups of cells. The small decrease in fluorescence could have been due to the exit of some dye during the second hypoosmotic exposure.
Next, we tested a range of other compounds. Propidium iodide, calcein salt, rose bengal, acid fuchsin, fluorescent brightener 28, Orange II, light green SF yellowish, trypan blue, and acid blue 9 did not penetrate the membranes of most cells (Fig. 3 shows the results of incubation with propidium iodide together with NaFl). Rhodamine B stained all cells irrespective of osmolarity (not shown). Hence, the increase in permeability in hypoosmotic solutions is specific to NaFl.
To estimate the rate of intracellular accumulation and disappearance of NaFl, we observed it in real-time using confocal microscopy. HeLa cells were grown in coverslip-bottom dishes, and 50% DMEM containing NaFl was added at t=0. The objective was focused on the middle parts of the cells, where fluorescence was minimally affected by a much brighter background. The observation was carried out for 15 min. A representative curve for NaFl uptake by a single cell is plotted in the left part of Fig. 4. The exact shape of the curve can be influenced by the choice of the focal plane, but we can certainly conclude that significant accumulation occurs as soon as 30 s after the addition of a hypoosmotic medium and continues steadily for at least 15 min. To assess the retention of NaFl upon removal of extracellular NaFl, a coverslip mounted on a slide was used instead of an open dish, because in this configuration, the solution can be exchanged much faster (see Methods). The release of intracellular fluorescence in NaFl-free 50% DMEM is slower than its prior accumulation (Fig. 4, right part). This may be due to weak binding of NaFl to proteins [36]. At later times, the loss of fluorescence slows down further, amounting to approximately ~1% decrease per minute (not shown).
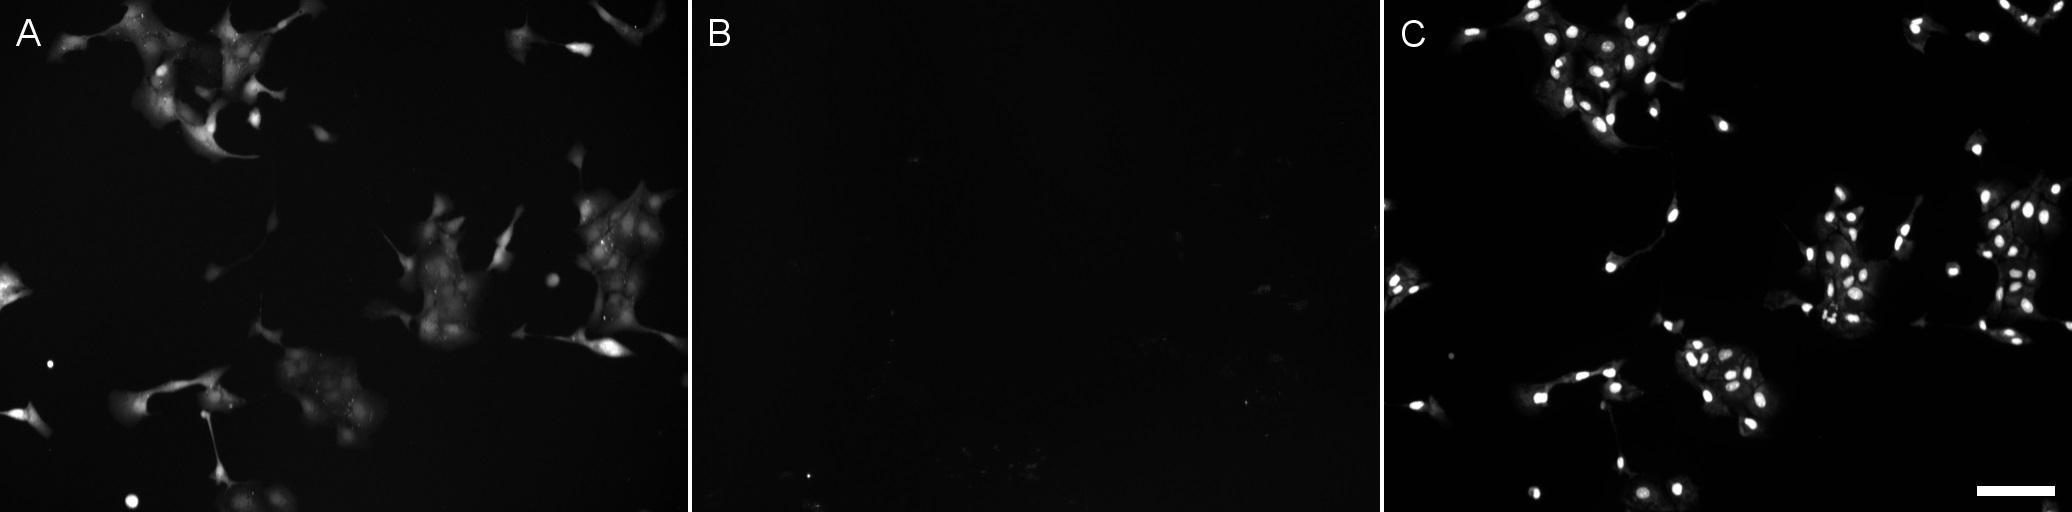
Fig. 3. MDCK cells were grown on coverslip and mounted on slides in isotonic 100% DMEM. At t=0 the medium was replaced with 50% DMEM containing 0.1 mM NaFl and 10 µM propidium iodide and imaged for NaFl staining (A) and PI staining (B) after 10 min. (C) PI staining after the medium was exchanged second time for 70% ethanol. Scale bar, 100 µM.
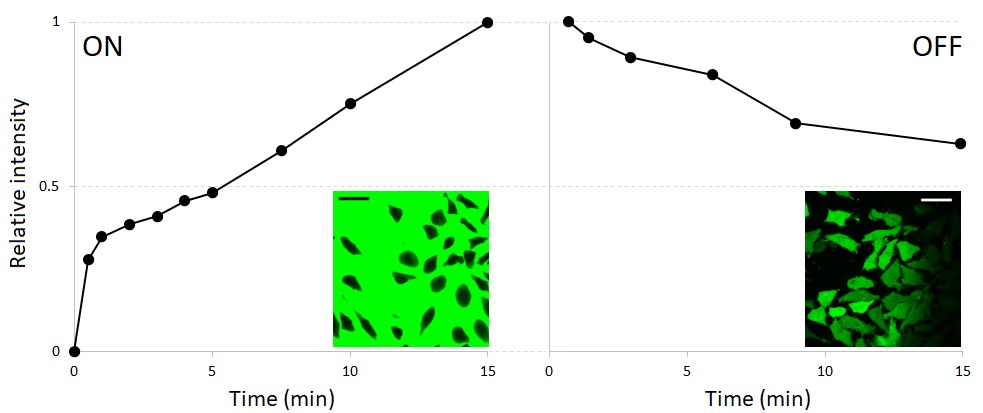
Fig. 4. Representative images and traces showing the accumulation and loss of NaFl in hypotonic 50% DMEM. The intensity was arbitrarily assigned the value of 1 at t=15 min of the accumulation phase (with extracellular NaFl, left) and t=45 s (when the first time point was recorded) of the release phase (in NaFl-free 50% DMEM, right). Scale bars in inserts, 25 µm. See text for more details.
As cell permeability to fluorescein increases under hypoosmotic conditions, we investigated whether the uptake of NaFl was mediated by VRACs, which open upon osmotic cell swelling and conduct a range of substrates. Both DCPIB and CBX, commonly used VRAC inhibitors [37-39], drastically diminished the fluorescein uptake by HeLa cells in hypoosmotic medium, DCPIB also reduced fluorescein uptake by 3T3 cells (Fig. 5), consistent with a role for VRAC activity in this process. To confirm the involvement of VRACs, we tested for hypotonicity-induced fluorescein uptake by 3T3 cells deficient in the essential VRAC subunit LRRC8A [26]. Indeed, LRRC8A-deficient cells did not take up fluorescein in isosmotic or hypoosmotic media (Fig. 5).
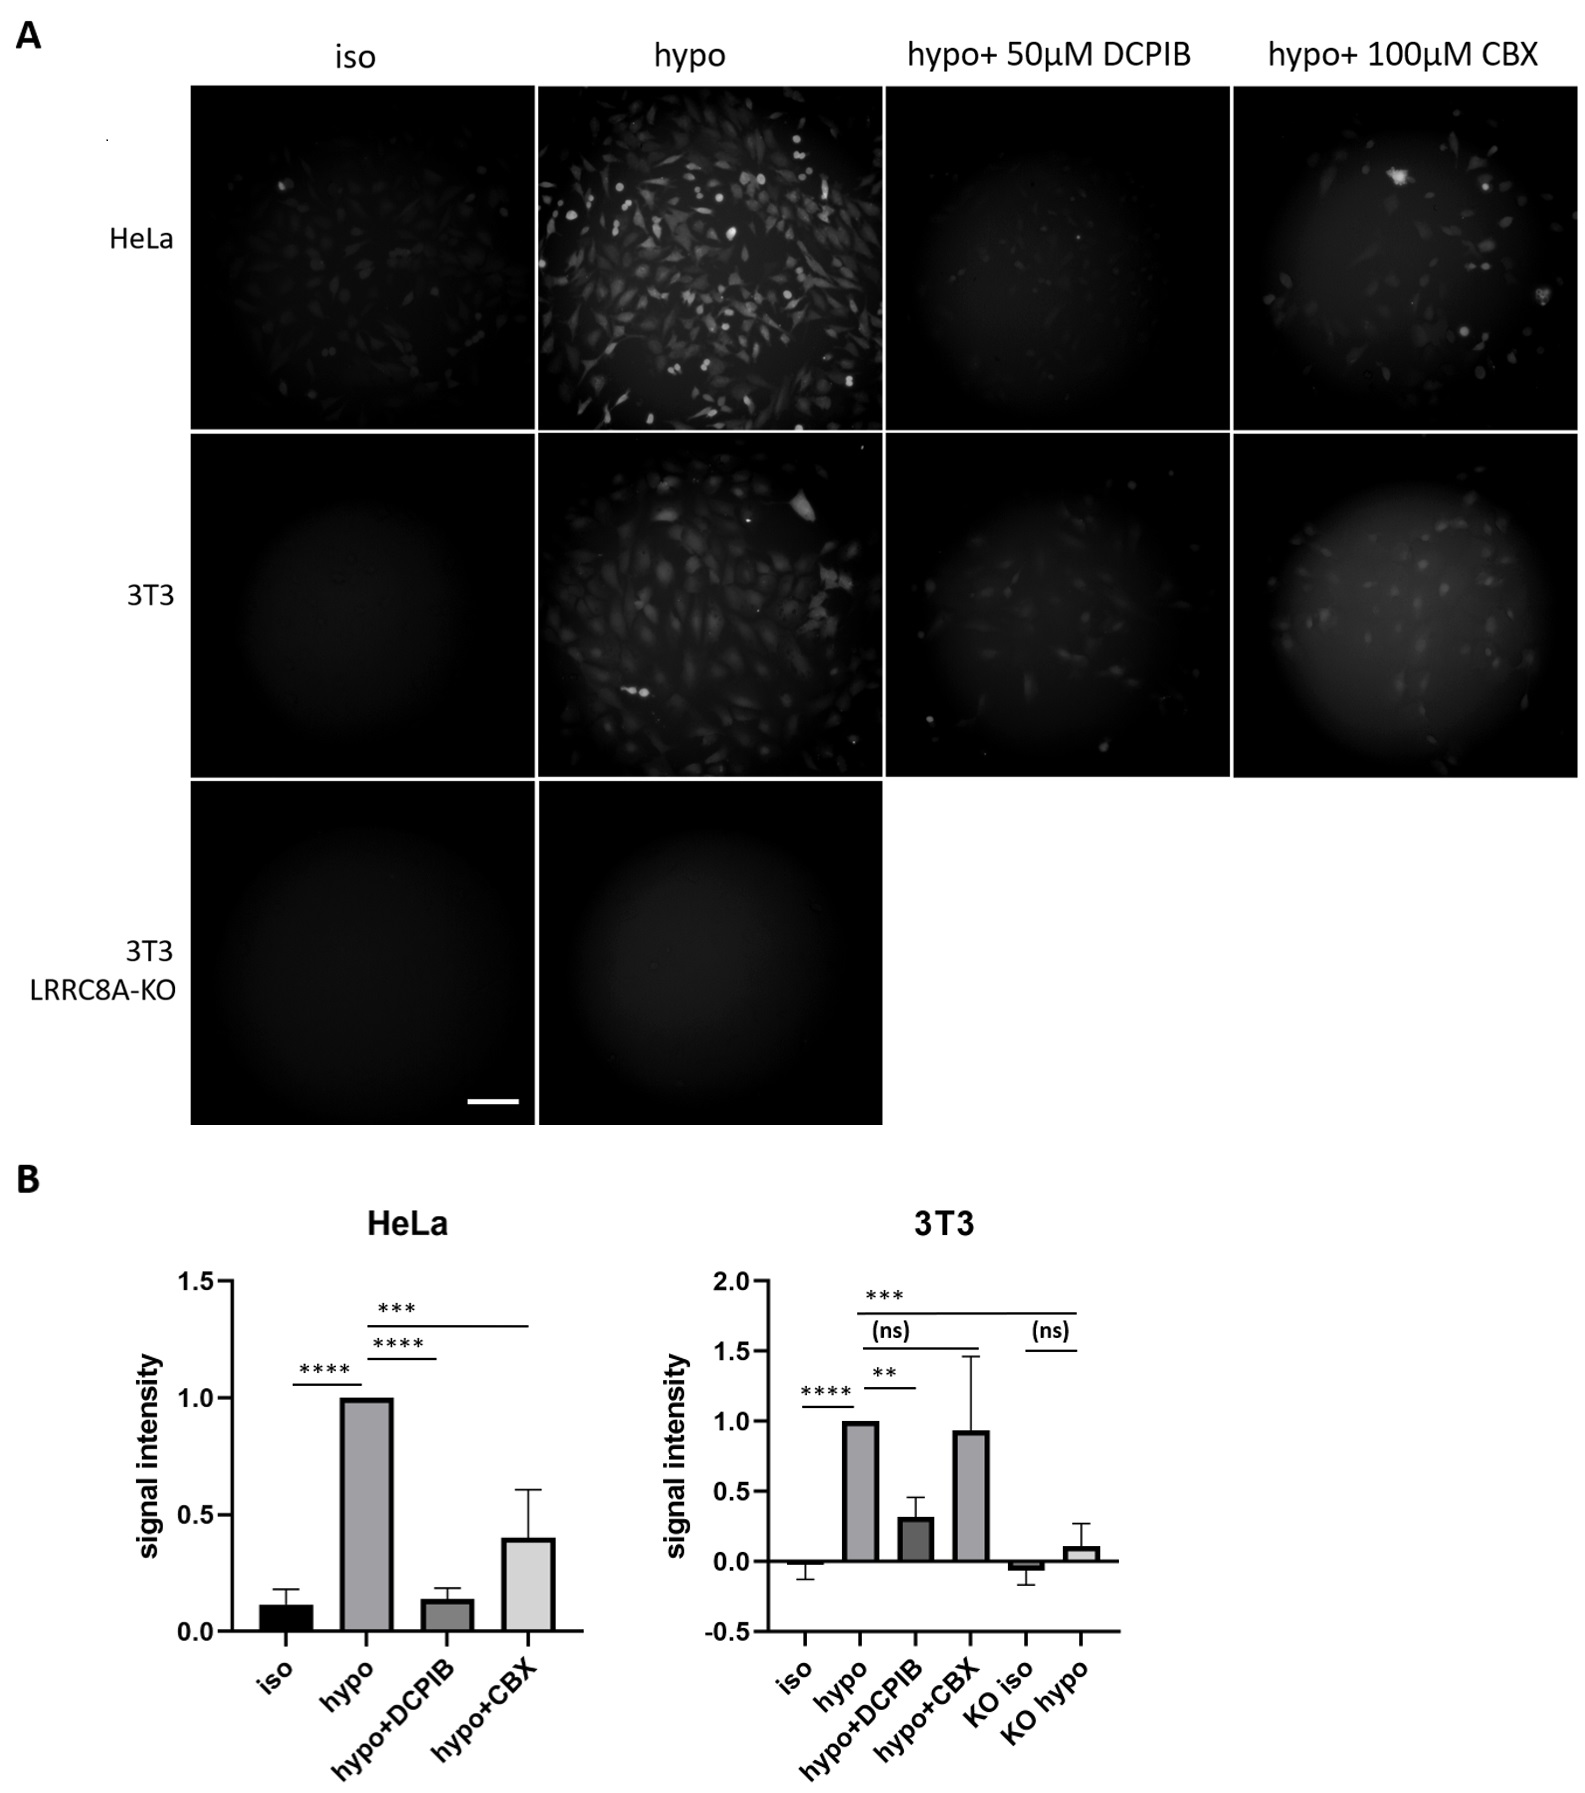
Fig. 5. Reduced fluorescein uptake upon LRRC8A depletion or pharmacological VRAC inhibition. After 10 min incubation with 0.1 mM NaFl in either isotonic 100% DMEM (iso) or hypotonic, 50% DMEM (hypo), the cells were imaged as described in Methods. Representative images are shown in part (A) and statistical analysis in part (B). In total from 4 independent experiments, 147 WT HeLa cells in hypotonic condition, 141 WT Hela cells in isotonic condition, 174 WT 3T3 cells in hypotonic condition, 156 WT 3T3 cells in isotonic condition, 158 KO 3T3 cells in hypotonic condition, and 146 KO 3T3 cells in isotonic condition were analyzed. For testing VRAC inhibitors, from 3 independent experiments, 97 WT 3T3 cells treated with DCPIB and 78 cells treated with CBX as well as 87 WT HeLa cells treated with DCPIB and 70 cells treated with CBX from 2 independent experiments were analyzed. In each experiment, the values were normalized to the mean value for WT cells in hypoosmotic conditions. The values in the graphs represent mean D. Statistical significance was assessed by one-way ANOVA, **p< 0.01, ***p< 0.001, ****p< 0.0001, ns p> 0.05. Scale bar in A, 100 μm.
Hypotonic loading is a known technique to introduce chemicals into cells [40, 41]. However, previous researchers have been mostly interested in achieving the loading rather than investigating the mechanism of penetration. In fact, dye loading seems to be underutilized as a possible method for channel characterization. Many common dyes, such as mitochondrial probes, apparently employ highly specific routes for cellular entry and could in principle be used to characterize the expression of channels if the nature of those channels was better known (Fig. 6).
The rationale for testing fluorescein (NaFl) as an external VRAC substrate was straightforward: first, fluorescein is an anion, and second, unless there is a perfect outward rectification, it should be able to pass through open channels both ways (despite the negative membrane potential). Indeed, this has previously been shown for other exogenous substances like blasticidin S and cisplatin [18, 24]. Furthermore, fluorescein is a frequently used, inexpensive, and nontoxic chemical: it is utilized in ophthalmology to visualize cornea and retina, in brain surgery to increase the visibility of tumors, and in plumbing to find leaky pipes. Once cells pick up fluorescein, it can be easily detected by fluorescence microscopy or flow cytometry. However, even after a 10 min incubation, intracellular concentration can remain as low as 10% of the external concentration (Table 1), and thorough removal of the NaFl-containing media is necessary. This can be quickly achieved by passing fresh solution under a coverslip (see Methods) or by otherwise exchanging the solutions. Fortunately, the loss of fluorescein from the cytoplasm occurs rather slowly (Fig. 4B), which provides enough time to rinse and image the cells. If the exact numbers are desired, real-time confocal imaging using a high-resolution objective may be necessary.
One potential limitation of fluorescein is its pH sensitivity. Fluorescence intensity of fluorescein reaches its maximum at pH≈8 [42]; therefore, if hypotonic treatment resulted in any major alkalinization it could lead to overestimation of intracellular concentration of fluorescein. This scenario is, however, unlikely, since the previous authors have only observed a minor acidification during osmotic swelling [43-45].
Our data show that uptake of fluorescein is dependent on the volume-regulated anion channel VRAC that is formed by LRRC8 proteins. Both DCPIB and CBX reduced hyotonicity-induced NaFl uptake by HeLa cells; and DCPIB also diminished uptake by 3T3 cells. Both inhibitors are not very specific for VRAC, they also inhibit, e.g., connexins [38, 46, 47]. DCPIB also affects a range of other ion transporters and channels including various potassium channels [48-51]. So, the pharmacological inhibition of VRAC is consistent with, but does not prove a role for this channel. More importantly, genetic disruption of the Lrrc8a gene, which encodes for the essential LRRC8A subunit of VRAC abolished hypotonicity-dependent NaFl uptake.
![Fig. 6. Staining of MDCK cells with rhodamine 123 (green) and DiIC1(5) (red). Both dyes enter mitochondria, but rhodamine 123 stains the periphery of MDCK colonies, while DiIC1(5) accumulates in the central parts. The heterogeneous staining does not result from competition, as it is also observed using single stains. Most likely, this heterogeneous staining reflects the distribution of yet unidentified channels used for the dye entry. From [25], with permission.](../images/Fig6.jpg)
Fig. 6. Staining of MDCK cells with rhodamine 123 (green) and DiIC1(5) (red). Both dyes enter mitochondria, but rhodamine 123 stains the periphery of MDCK colonies, while DiIC1(5) accumulates in the central parts. The heterogeneous staining does not result from competition, as it is also observed using single stains. Most likely, this heterogeneous staining reflects the distribution of yet unidentified channels used for the dye entry. From [25], with permission.
The basal fluorescein permeability in isosmotic DMEM is low but measurable (Table 1). Although we observed no statistically significant difference in NaFl uptake under isosmotic conditions between wildtype and Lrrc8a-disrupted 3T3 cells (Fig. 5B), we have been unable to definitively conclude whether isosmotic NaFl uptake is due to low constitutive conductance of VRAC or some other, VRAC-unrelated mechanism. Cisplatin, another transport substrate of VRAC is taken up under isotonic conditions. However, only a fraction of cisplatin enters the cell via VRAC. Intracellular cisplatin then induces apoptosis and as an early event the activation of VRAC, which in turn can mediate the influx of cisplatin [18].
In conclusion, we have identified the anionic fluorescent dye fluorescein as a VRAC substrate. This was confirmed by pharmacological inhibition of VRAC and by genetic depletion of the essential LRRC8A subunit, which abolished fluorescein uptake upon osmotic cell swelling. The simplicity and minimal cost of the assay can make it a useful addition to the arsenal of available methods for monitoring VRAC activity [7, 8, 52, 53].
Author Contributions
MM designed and performed experiments and wrote the manuscript; FHN, EZ and JH performed experiments and edited the manuscript, TS designed experiments and wrote the manuscript.
Funding
The work was supported by the Kent State University Research Council (MM) and intramural MSH Medical School Hamburg funding (TS).
Statement of Ethics
The authors have no ethical conflicts to disclose.
The authors have no conflicts of interest to declare.
Hoffmann EK, Lambert IH, Pedersen SF: Physiology of cell volume regulation in vertebrates. Physiol Rev 2009;89:193-277.
https://doi.org/10.1152/physrev.00037.2007Lang F: Mechanisms and significance of cell volume regulation. J Am Coll Nutr 2007;26:613S-623S.
https://doi.org/10.1080/07315724.2007.10719667Bortner CD, Cidlowski JA: A necessary role for cell shrinkage in apoptosis. Biochem Pharmacol 1998;56:1549-1559.
https://doi.org/10.1016/S0006-2952(98)00225-1Lang F, Hoffmann EK: Role of ion transport in control of apoptotic cell death. Compr Physiol 2012;2:2037-2061.
https://doi.org/10.1002/cphy.c110046Orlov SN, Platonova AA, Hamet P, Grygorczyk R: Cell volume and monovalent ion transporters: their role in cell death machinery triggering and progression. Am J Physiol Cell Physiol 2013;305:C361-372.
https://doi.org/10.1152/ajpcell.00040.2013Chen L, König B, Liu T, Pervaiz S, Razzaque YS, Stauber T: More than just a pressure relief valve: physiological roles of volume-regulated LRRC8 anion channels. Biol Chem 2019:doi: 10.1515/hsz-2019-0189.
https://doi.org/10.1515/hsz-2019-0189Voss FK, Ullrich F, Münch J, Lazarow K, Lutter D, Mah N, Andrade-Navarro MA, von Kries JP, Stauber T, Jentsch TJ: Identification of LRRC8 heteromers as an essential component of the volume-regulated anion channel VRAC. Science 2014;344:634-638.
https://doi.org/10.1126/science.1252826Qiu Z, Dubin AE, Mathur J, Tu B, Reddy K, Miraglia LJ, Reinhardt J, Orth AP, Patapoutian A: SWELL1, a plasma membrane protein, is an essential component of volume-regulated anion channel. Cell 2014;157:447-458.
https://doi.org/10.1016/j.cell.2014.03.024Stauber T: The volume-regulated anion channel is formed by LRRC8 heteromers - molecular identification and roles in membrane transport and physiology. Biol Chem 2015;396:975-990.
https://doi.org/10.1515/hsz-2015-0127Jentsch TJ: VRACs and other ion channels and transporters in the regulation of cell volume and beyond. Nat Rev Mol Cell Biol 2016;17:293-307.
https://doi.org/10.1038/nrm.2016.29Strange K, Yamada T, Denton JS: A 30-year journey from volume-regulated anion currents to molecular structure of the LRRC8 channel. J Gen Physiol 2019;151:100-117.
https://doi.org/10.1085/jgp.201812138Pedersen SF, Okada Y, Nilius B: Biophysics and Physiology of the Volume-Regulated Anion Channel (VRAC)/Volume-Sensitive Outwardly Rectifying Anion Channel (VSOR). Pflugers Arch 2016;468:371-383.
https://doi.org/10.1007/s00424-015-1781-6König B, Stauber T: Biophysics and Structure-Function Relationships of LRRC8-Formed Volume-Regulated Anion Channels. Biophys J 2019;116:1185-1193.
https://doi.org/10.1016/j.bpj.2019.02.014Kirk K, Ellory JC, Young JD: Transport of organic substrates via a volume-activated channel. J Biol Chem 1992;267:23475-23478.
https://doi.org/10.1016/S0021-9258(18)35862-9Jackson PS, Strange K: Volume-sensitive anion channels mediate swelling-activated inositol and taurine efflux. Am J Physiol 1993;265:C1489-1500.
https://doi.org/10.1152/ajpcell.1993.265.6.C1489Friard J, Corinus A, Cougnon M, Tauc M, Pisani DF, Duranton C, Rubera I: LRRC8/VRAC channels exhibit a noncanonical permeability to glutathione, which modulates epithelial-to-mesenchymal transition (EMT). Cell Death Dis 2019;10:925.
https://doi.org/10.1038/s41419-019-2167-zHyzinski-García MC, Rudkouskaya A, Mongin AA: LRRC8A protein is indispensable for swelling-activated and ATP-induced release of excitatory amino acids in rat astrocytes. J Physiol 2014;592:4855-4862.
https://doi.org/10.1113/jphysiol.2014.278887Planells-Cases R, Lutter D, Guyader C, Gerhards NM, Ullrich F, Elger DA, Kucukosmanoglu A, Xu G, Voss FK, Reincke SM, Stauber T, Blomen VA, Vis DJ, Wessels LF, Brummelkamp TR, Borst P, Rottenberg S, Jentsch TJ: Subunit composition of VRAC channels determines substrate specificity and cellular resistance to Pt-based anti-cancer drugs. EMBO J 2015;34:2993-3008.
https://doi.org/10.15252/embj.201592409Gaitán-Peñas H, Gradogna A, Laparra-Cuervo L, Solsona C, Fernández-Dueñas V, Barrallo-Gimeno A, Ciruela F, Lakadamyali M, Pusch M, Estévez R: Investigation of LRRC8-Mediated Volume-Regulated Anion Currents in Xenopus Oocytes. Biophys J 2016;111:1429-1443.
https://doi.org/10.1016/j.bpj.2016.08.030Schober AL, Wilson CS, Mongin AA: Molecular composition and heterogeneity of the LRRC8-containing swelling-activated osmolyte channels in primary rat astrocytes. J Physiol 2017;595:6939-6951.
https://doi.org/10.1113/JP275053Lutter D, Ullrich F, Lueck JC, Kempa S, Jentsch TJ: Selective transport of neurotransmitters and modulators by distinct volume-regulated LRRC8 anion channels. J Cell Sci 2017;130:1122-1133.
https://doi.org/10.1242/jcs.196253Zhou C, Chen X, Planells-Cases R, Chu J, Wang L, Cao L, Li Z, López-Cayuqueo KI, Xie Y, Ye S, Wang X, Ullrich F, Ma S, Fang Y, Zhang X, Qian Z, Liang X, Cai SQ, Jiang Z, Zhou D, et al.: Transfer of cGAMP into Bystander Cells via LRRC8 Volume-Regulated Anion Channels Augments STING-Mediated Interferon Responses and Anti-viral Immunity. Immunity 2020;52:767-781.e766.
https://doi.org/10.1016/j.immuni.2020.03.016Lahey LJ, Mardjuki RE, Wen X, Hess GT, Ritchie C, Carozza JA, Bohnert V, Maduke M, Bassik MC, Li L: LRRC8A:C/E Heteromeric Channels Are Ubiquitous Transporters of cGAMP. Mol Cell 2020;80:578-591 e575.
https://doi.org/10.1016/j.molcel.2020.10.021Lee CC, Freinkman E, Sabatini DM, Ploegh HL: The protein synthesis inhibitor blasticidin s enters mammalian cells via leucine-rich repeat-containing protein 8D. J Biol Chem 2014;289:17124-17131.
https://doi.org/10.1074/jbc.M114.571257Gibbons BA, Kharel P, Robinson LC, Synowicki RA, Model MA: Volume measurements and fluorescent staining indicate an increase in permeability for organic cation transporter substrates during apoptosis. Exp Cell Res 2016;344:112-119.
https://doi.org/10.1016/j.yexcr.2016.03.018Pervaiz S, Kopp A, von Kleist L, Stauber T: Absolute Protein Amounts and Relative Abundance of Volume-regulated Anion Channel (VRAC) LRRC8 Subunits in Cells and Tissues Revealed by Quantitative Immunoblotting. Int J Mol Sci 2019;20:5879.
https://doi.org/10.3390/ijms20235879Model MA: Intensity calibration and shading correction for fluorescence microscopes. Curr Protoc Cytom 2006;Chapter 10:Unit10 14.
https://doi.org/10.1002/0471142956.cy1014s37Model MA, Reese JL, Fraizer GC: Measurement of wheat germ agglutinin binding with a fluorescence microscope. Cytometry A 2009;75:874-881.
https://doi.org/10.1002/cyto.a.20787Model MA: Comparison of cell volume measurements by fluorescence and absorption exclusion microscopy. J Microsc 2020:DOI: 10.1111/jmi.12929
https://doi.org/10.1111/jmi.12929Model MA, Burkhardt JK: A standard for calibration and shading correction of a fluorescence microscope. Cytometry 2001;44:309-316.
https://doi.org/10.1002/1097-0320(20010801)44:4<309::AID-CYTO1122>3.0.CO;2-3Gregg JL, McGuire KM, Focht DC, Model MA: Measurement of the thickness and volume of adherent cells using transmission-through-dye microscopy. Pflugers Arch 2010;460:1097-1104.
https://doi.org/10.1007/s00424-010-0869-2Model MA: Cell Volume Measurements by Optical Transmission Microscopy. Curr Protoc Cytom 2019;90:e62.
https://doi.org/10.1002/cpcy.62Model MA, Khitrin AK, Blank JL: Measurement of the absorption of concentrated dyes and their use for quantitative imaging of surface topography. J Microsc 2008;231:156-167.
https://doi.org/10.1111/j.1365-2818.2008.02026.xSolenov E, Watanabe H, Manley GT, Verkman AS: Sevenfold-reduced osmotic water permeability in primary astrocyte cultures from AQP-4-deficient mice, measured by a fluorescence quenching method. Am J Physiol Cell Physiol 2004;286:C426-432.
https://doi.org/10.1152/ajpcell.00298.2003Rana PS, Gibbons BA, Vereninov AA, Yurinskaya VE, Clements RJ, Model TA, Model MA: Calibration and characterization of intracellular Asante Potassium Green probes, APG-2 and APG-4. Anal Biochem 2019;567:8-13.
https://doi.org/10.1016/j.ab.2018.11.024Braginskaja OV, Lazarev VV, Pershina IN, Petrov KV, Rubin LB, Tikhonova OV: Sodium fluorescein accumulation in cultured cells. Gen Physiol Biophys 1993;12:453-464.
Decher N, Lang HJ, Nilius B, Bruggemann A, Busch AE, Steinmeyer K: DCPIB is a novel selective blocker of ICl,swell and prevents swelling-induced shortening of guinea-pig atrial action potential duration. Br J Pharmacol 2001;134:1467-1479.
https://doi.org/10.1038/sj.bjp.0704413Benfenati V, Caprini M, Nicchia GP, Rossi A, Dovizio M, Cervetto C, Nobile M, Ferroni S: Carbenoxolone inhibits volume-regulated anion conductance in cultured rat cortical astroglia. Channels (Austin) 2009;3:323-336.
https://doi.org/10.4161/chan.3.5.9568Friard J, Tauc M, Cougnon M, Compan V, Duranton C, Rubera I: Comparative Effects of Chloride Channel Inhibitors on LRRC8/VRAC-Mediated Chloride Conductance. Front Pharmacol 2017;8:328.
https://doi.org/10.3389/fphar.2017.00328Stewart MP, Langer R, Jensen KF: Intracellular Delivery by Membrane Disruption: Mechanisms, Strategies, and Concepts. Chem Rev 2018;118:7409-7531.
https://doi.org/10.1021/acs.chemrev.7b00678Gan BS, Krump E, Shrode LD, Grinstein S: Loading pyranine via purinergic receptors or hypotonic stress for measurement of cytosolic pH by imaging. Am J Physiol 1998;275:C1158-1166.
https://doi.org/10.1152/ajpcell.1998.275.4.C1158Zhu H, Derksen RC, Krause CR, Fox RD, Brazee RD, Ozkan HE: Fluorescent intensity of dye solutions under different pH conditions. ASTM International 2005;2
https://doi.org/10.1520/JAI12926Gleeson D, Corasanti JG, Boyer JL: Effects of osmotic stresses on isolated rat hepatocytes. II. Modulation of intracellular pH. Am J Physiol 1990;258:G299-307.
https://doi.org/10.1152/ajpgi.1990.258.2.G299Hallows KR, Restrepo D, Knauf PA: Control of intracellular pH during regulatory volume decrease in HL-60 cells. Am J Physiol 1994;267:C1057-1066.
https://doi.org/10.1152/ajpcell.1994.267.4.C1057Rodighiero S, Botta G, Bazzini C, Meyer G: Pendrin overexpression affects cell volume recovery, intracellular pH and chloride concentration after hypotonicity-induced cell swelling. Cell Physiol Biochem 2011;28:559-570.
https://doi.org/10.1159/000335120Bowens NH, Dohare P, Kuo YH, Mongin AA: DCPIB, the proposed selective blocker of volume-regulated anion channels, inhibits several glutamate transport pathways in glial cells. Mol Pharmacol 2013;83:22-32.
https://doi.org/10.1124/mol.112.080457Ye ZC, Oberheim N, Kettenmann H, Ransom BR: Pharmacological "cross-inhibition" of connexin hemichannels and swelling activated anion channels. Glia 2009;57:258-269.
https://doi.org/10.1002/glia.20754Minieri L, Pivonkova H, Caprini M, Harantova L, Anderova M, Ferroni S: The inhibitor of volume-regulated anion channels DCPIB activates TREK potassium channels in cultured astrocytes. Br J Pharmacol 2013;168:1240-1254.
https://doi.org/10.1111/bph.12011Deng W, Mahajan R, Baumgarten CM, Logothetis DE: The ICl,swell inhibitor DCPIB blocks Kir channels that possess weak affinity for PIP2. Pflugers Arch 2016;468:817-824.
https://doi.org/10.1007/s00424-016-1794-9Lv J, Liang Y, Zhang S, Lan Q, Xu Z, Wu X, Kang L, Ren J, Cao Y, Wu T, Lin KL, Yung KKL, Cao X, Pang J, Zhou P: DCPIB, an Inhibitor of Volume-Regulated Anion Channels, Distinctly Modulates K2P Channels. ACS Chem Neurosci 2019;10:2786-2793.
https://doi.org/10.1021/acschemneuro.9b00010Zuccolini P, Ferrera L, Remigante A, Picco C, Barbieri R, Bertelli S, Moran O, Gavazzo P, Pusch M: The VRAC blocker DCPIB directly gates the BK channels and increases intracellular Ca(2+) in melanoma and pancreatic duct adenocarcinoma cell lines. Br J Pharmacol 2022
https://doi.org/10.1016/j.bpj.2021.11.282König B, Hao Y, Schwartz S, Plested AJ, Stauber T: A FRET sensor of C-terminal movement reveals VRAC activation by plasma membrane DAG signaling rather than ionic strength. Elife 2019;8:e45421.
https://doi.org/10.7554/eLife.45421Kolobkova Y, Pervaiz S, Stauber T: The expanding toolbox to study the LRRC8-formed volume-regulated anion channel VRAC. Curr Top Membr 2021;88:119-163.
https://doi.org/10.1016/bs.ctm.2021.10.001