Review - DOI:10.33594/000000593
Accepted 18 November 2022 - Published online : 7 December 2022
Physiological Laboratory, Department of Physiology, Development and Neuroscience, University of Cambridge, Downing Site, Cambridge CB2 3EG, UK
Alexey Vereninov and collaborators pioneered the application of mathematical models of cellular homeostasis with ground-breaking contributions to the understanding of the mechanisms behind the dynamics of homeostatic changes in a variety of different cell types. As part of an issue dedicated to Vereninov’s memory, I thought that an example of the predictive potential of such models would be a fitting tribute to his work and achievements. The “Gardos effect” is the example chosen from our modelling experience.
The Gardos effect
Over six decades ago, Gardos reported that the joint addition of a metabolic inhibitor and a metabolic substrate to a suspension of human red blood cells (RBCs) incubated at 37°C in plasma-like media triggered an extreme dehydration of the RBCs after a variable delay period [1-3]. Reducing the extracellular Ca2+ concentration prevented dehydration. Years later, the mystery surrounding the sequential steps involved in this “Gardos effect” was elucidated. The inhibitor-substrate combinations (iodoacetamide with glucose or inosine, for instance) were shown to cause rapid and profound ATP depletion, the substrate consuming ATP during the initial steps of glycolytic metabolism while downstream ATP production remained blocked by the inhibitor [4-6]. Progressive ATP depletion gradually inhibited the plasma membrane calcium pump (PMCA) [7, 8] allowing a slow build-up of the intracellular free calcium concentration, [Ca2+]i. Elevated [Ca2+]i, in turn, activated a Ca2+-sensitive K+-selective permeability pathway leading to rapid KCl loss and cell dehydration. Gardos’ landmark discovery of this permeability pathway was eventually recognized as the first report of a calcium-sensitive K+ channel, (KCa3.1, KCNN4 gene), baptized as the Gardos channel in the RBC lore. Gardos channels participate in the process of progressive RBC densification during circulatory senescence [9, 10], mediate sickle cell dehydration in sickle cell disease [11-13], and channel mutations contribute to the pathophysiology of congenital haemolytic anaemias with altered RBC hydration states [14-16].
When we first simulated the Gardos effect using a RBC model (RCM) [17], the results predicted not only the expected calcium-depended dehydration of the cells but also some totally unexpected and puzzling side-effects: cell acidification, medium alkalinization, loss of an hypertonic alkaline effluent of KCl and KOH, and a globally increased osmolarity in the cell suspension. Suspecting hidden bugs behind such inexplicable predictions we immediately searched for culprits. Rather than bugs, the search exposed an entangled but perfectly plausible mechanistic set of interactions among cell processes of a complexity beyond intuitive grasp. Experimental tests soon confirmed these predictions [18, 19] which became instrumental in explaining the mechanism of irreversible sickle cell formation in sickle cell disease [12, 20, 21], and the strategy falciparum parasites evolved to prevent the premature lysis of host RBCs during the reproductive cycle of the parasite [22].
I will show first how we applied the red cell model (RCM) to simulate the Gardos effect and explore its multiple side-effects. Analysis of the results explains in detail the mechanisms by which the enmeshed interactions of many RBC transport, buffering and metabolic processes linked cell dehydration and protein crowding to cell acidification and to the generation of hypertonic, alkaline effluents.
A brief primer on red blood cell homeostasis
The main function of RBCs is to mediate the transport of O2 and CO2 between lungs and tissues by mechanisms evolved to minimize the energy cost to the organism. A first critical feature enabling such economy is the extremely low cation permeability of the RBC membrane [23-25]. This allows the cells to maintain steady volumes for extended periods of time with minimal cation traffic, pump-leak turnover rates and ATP consumption. Glycolytic ATP turnover by the full RBC mass of a healthy human adult amounts to less than 0.06% of the total body ATP turnover [26].
A second critical feature of the optimized economy concerns the compromise between RBC turnover rate and circulatory lifespan. RBCs are the most abundant cells in the body, their mass adapted for adequate gas transport at all levels of physiological demand. Biosynthetic and biodegradable replacement of such a large cell mass imposes a heavy metabolic cost to the organism which can only be reduced by extending the circulatory lifespan of the cells thereby reducing their replacement frequency. Circulatory longevity, on the other hand, is limited by the extent to which RBCs, without nucleus and organelles, and devoid of biosynthetic capacity, can sustain the functional competence of its metabolic and membrane transport components required for volume stability and optimal rheology. Optimal rheology requires that the RBCs retain a large degree of deformability to squeeze through narrow capillaries and minimize diffusional distances for gas-exchange across capillary walls. Deformability, in turn, depends on the RBCs maintaining their volume well below their maximal spherical volume, a condition fulfilled when the ratio between actual to maximal volume allowed by the membrane area is kept within a narrow margin around 60% [26-28]. For human RBCs with a mean circulatory lifespan of about 120 days, this represents a substantial challenge.
RBC homeostasis involves a subset of basic cellular processes that attempt to maintain and restore cell volume and integrity throughout all dynamic changes elicited by physiological stress. Although all RBC components participate in global cell responses, the main players within the subset concerned with RBC homeostasis are: i) all the passive and active transporters of the plasma membrane, ii) haemoglobin, which is the main macromolecular colloid osmotic contributor and the main cytoplasmic proton and calcium buffer, iii) the variety of impermeant cell metabolites and solutes which contribute fixed negative charges and additional proton, calcium and magnesium buffering capacity to the RBC cytoplasm. Most of the haemolytic anaemias affecting humans result from inherited mutations in components of the homeostasis subset or from parasitic invasions. Early versions of the red blood cell model proved a valuable tool for unravelling the complex pathophysiology in some of these diseases [12, 22, 29, 30].
A brief primer on the red blood cell model (RCM)
The executable file of the model, RCM*.jar, as well as a User Guide and a file with the governing equations of the model are freely available for downloading from the following GitHub repository: https://github.com/sdrogers/redcellmodeljava. The model operates as a RCM*.jar programme within the JAVA environment which needs to be preinstalled. It is recommended not to alter the original file name as it contains coded information on date and update status.
The RCM describes the dynamic behaviour of a suspension of identical red blood cell in plasma-like media, treated as a closed two-compartment system. The physical laws constraining the behaviour of such a system are charge and mass conservation. Relative cell volume (RCV) is the critical variable in models of cellular homeostasis. In RBCs, RCV has a maximum value corresponding to a spherical configuration, leading to cell lysis when exceeded. Cell membrane areas are assumed constant. Cell shape changes are only indirectly addressed in the model through the ratio between actual and maximal spherical RCVs, a critical rheological parameter with a value around 0.6 for RBCs of healthy adult human subjects.
Models of cellular homeostasis start with an electroneutral cell system in an initial reference steady-state of balanced pump-leak fluxes. Following perturbations, the equation that ensures sustained charge conservation and electroneutrality in a system with j electrogenic transporters is ∑Ij = 0. Each Ij describes the current carried by channels or electrogenic carriers and pumps across the cell plasma membrane. The relation between currents, I, and fluxes, F, is given by Ij = FzjFj, where F is the Faraday constant and zj the electogenic valence of transporter j. The flux equations, Fj, define the kinetics of the transporter representation in the model. The current equations, Ij, are a function of the membrane potential, Em, of the concentration of the transported substrates on each membrane side, on modulating factors such temperature, pH, [Ca2+]i, [Mg2+]i, other ions, solutes and metabolites. ∑Ij = 0 is therefore a complex implicit equation. When the parameters and kinetics of all the individual flux equations are either known or phenomenologically defined, as expected for a cell type mature for modelling such as the human red blood cell, ∑Ij = 0 becomes an implicit equation in Em, the single unknown left, easily solved numerically at the start of each iteration step in the running of the model.
∑Ij = 0 and Entanglement
Charge conservation imposes an extraordinary level of entanglement in the processes that shape global cell responses. For example, consider an ion channel becoming activated in a cell at rest. Em changes, and so do all voltage-sensitive Ij, causing secondary changes in the concentrations of transported substrates. Some of these substrates are shared by electroneutral transporters, altering their fluxes and causing additional changes in the concentrations of intracellular solutes. In turn, all transport, biochemical and metabolic processes that depend on the concentration of intracellular solutes and on cell osmolarity also become affected generating chains of complex, interlinked interactions all influencing the global cell response. The magnitude of individual and global changes may vary over orders of magnitude, but the web of interconnected influences is always there. Homeostatic entanglement renders intuition a very fallible instrument for predicting global cell behaviour and for understanding the mechanisms behind complex cell responses, as was amply demonstrated in the past [17, 18, 20-22, 29, 31-35].
The parameter space
Parameter values in the RBC model are tightly constrained by solid data from the literature enabling model predictions to be semi-quantitative to levels of between 5 and 10%. To interpret this margin, it is important to realize a critical difference between experiments at the bench and their model representation. At the bench, experiments are performed on cell populations in suspensions or on chosen isolated cells from a cell population sample, as with patch-clamp or electrode measurements. The RCM, on the other hand, predicts the behaviour of a single cell defined by the constitutive properties attributed to it when specifying initial conditions. To investigate population behaviour with the model it is necessary to run multiple identical simulations on RBCs defined with hypothesized variations in cell properties or components [36, 37]. Weighted proportions attributed to each variant within a defined distribution render predicted outcomes for the integrated response of the cell population under study. These can then be compared with experimental results to trace the nature of the hypothesized variant or distribution abnormality [38].
Concentration and flux units in the RCM
For experimental tests of model predictions convenience demands that model variables be expressed in units comparable to those used in research for each cell type. RBC concentrations are usually expressed in mol subunits (mmol, μmol) per litre cells (/Lc), per litre cell water (/Lcw), or per litre original cells (/Loc). The “original” qualifier is used to describe a fixed number of cells assumed to be contained in one litre of packed RBCs, usually about 1013, with the properties attributed to RBCs at the start of experiments or at the start of model simulations. The “original” qualifier is particularly important for reporting fluxes across a constant area of membrane as an invariant reference, decoupled from cell volume changes. The RCM reports fluxes in mol subunits “per litre original cells per hour” (/Loch).
Simulating the Gardos effect
Model simulations are initiated by formulating a question and designing an experimental protocol expected to provide the answer. The experimental protocol is then simulated using the model. For our sample of the Gardos effect, we ask: what are the effects of a sudden and simultaneous inhibition of the Na/K and calcium pumps on RBCs suspended in plasma-like media and incubated at 37°C? With this formulation we bypass the inhibitor-substrate stage of the original Gardos effect and focus on the downstream effects of pump inhibition by ATP depletion. There is also a simple experimental correlate for such a simulation. Vanadate orthophosphate, a well-known irreversible inhibitor of P-type ATPases, the family the Na/K and PMCA pumps belong to, instantly blocks pump-mediated transport when added to RBC suspensions, without affecting RBC metabolism [39, 40]. We outline first a detailed version of the experimental protocol and follow up with the simulated correlate in the model.
At the bench, we start with fresh, washed RBCs free of white cells and platelets, suspended in a plasma-like saline at a 10% cell volume fraction (0.1 CVF equivalent to 10% haematocrit, Hct). The suspension is kept at 37°C under constant magnetic stirring to prevent cell sedimentation and the formation of significant diffusional gradients. After about 30 min to allow for minor adjustments to the new conditions, we add vanadate to instantly block ion transport through the Na/K and calcium pumps, and follow the evolution in time of system variables, the vanadate version of the Gardos effect protocol.
In the simulations we bypass the usual preparatory steps from drawing blood to washing the RBCs free of plasma, white cells and platelets. We start with a 0.1 cell volume fraction (CVF) in a plasma-like, isosmotic HEPES-Na-buffered saline solution at 37°C and probe system stability over a control period. Vanadate addition is represented by sudden 100% inhibition of Na/K and PMCA pumps, and the model follows the evolution in time of all the variables in the system. Because the cell-medium system is treated as a closed, two-compartment system, mass conservation applies, and redistribution equations compute the composition changes in each compartment at each instant of time. Instant, gradient-free uniformity in the composition of cell and medium compartments is assumed throughout representing the approximation intended by magnetic stirring in the experimental protocol. Simulated protocols are stored in text files, and model outputs reporting the changes in all the homeostasis variables of the system as a function of time are saved as comma separated (csv) spreadsheets [10].
Predicted time-course of changes in RBC volume, membrane potentials, calcium contents and Gardos channel mediated K+ flux following vanadate addition
Following pump-inhibition, the changes in RCV (Fig. 1A) show three distinct phases, a slow initial increase, an accelerating fall, and a late shallow slow volume recovery. The initial and late slow rates of volume increase result from Na/K pump inhibition, as may be shown by re-running the vanadate protocol without Na/K pump inhibition. The reason for such slow rates of volume change and cation gradient dissipation is the extremely low permeability of the RBC plasma membrane to Na+, K+, and to cations in general, an evolutionary optimized condition allowing RBC volume maintenance with minimal pump-leak turnover rates and energy consumption [26].The volume decline during the second phase follows the increasing Gardos channel activation pattern by [Ca2+]i (Fig. 1A and 1B). The delay is caused by the slow increase in [CaT]i and [Ca2+]i following PMCA inhibition (Fig. 1B). The low Ca2+ permeability of the RBC membrane [6, 41] limits the rate at which [CaT]i increases. Cytoplasmic Ca2+ buffering keeps [Ca2+]i well below [CaT]i as [CaT]i increases [42, 43]. Fig. 1C and 1D show the time-course associated with hyperpolarization and channel-mediated K+ flux, respectively. It can be seen (Fig. 1C) that the membrane potential follows closely the anion equilibrium potential throughout all the periods, reflecting the dominance of anion conductance in the RBC membrane [44-46]. The Em-EA-EK convergence in the end (Fig. 1C) reflects the new ion-gradient distribution generated after full dissipation of the K+ gradient. The K+ efflux curve through the Gardos channel (Fig. 1D) shows a biphasic pattern, first a large down-gradient K+ efflux followed by a decline as the K+ concentration gradient dissipates.
![Predicted changes in selected RBC variables as a function of time following sudden inhibition of the Na/K and calcium pumps by vanadate. A: relative cell volume changes due to Na/K pump inhibition and to delayed activation of Gardos channels by slow [Ca2+]i gain; B: changes in total ([CaT]i) and free ([Ca2+]i) cytoplasmic calcium concentrations following PMCA inhibition; C: changes in membrane potential, Em, and in the equilibrium potentials of K+ and diffusible anions (A-), EK and EA (EA = ECl = EHCO3), respectively, with time-patterns determined by Gardos channel activation kinetics and by ion gradient dissipation; D: Net K+ flux though the Gardos channel. The biphasic pattern results from changes in the K+ gradient across the plasma membrane. The increasing downhill efflux phase is followed by a decreasing efflux phase as the electrochemical driving gradient of K+ dissipates. The minimal initial and late contributions of Na/K pump inhibition are hardly noticeable on this y-axis scale.](../images/Fig1_3.jpg)
Fig. 1. Predicted changes in selected RBC variables as a function of time following sudden inhibition of the Na/K and calcium pumps by vanadate. A: relative cell volume changes due to Na/K pump inhibition and to delayed activation of Gardos channels by slow [Ca2+]i gain; B: changes in total ([CaT]i) and free ([Ca2+]i) cytoplasmic calcium concentrations following PMCA inhibition; C: changes in membrane potential, Em, and in the equilibrium potentials of K+ and diffusible anions (A-), EK and EA (EA = ECl = EHCO3), respectively, with time-patterns determined by Gardos channel activation kinetics and by ion gradient dissipation; D: Net K+ flux though the Gardos channel. The biphasic pattern results from changes in the K+ gradient across the plasma membrane. The increasing downhill efflux phase is followed by a decreasing efflux phase as the electrochemical driving gradient of K+ dissipates. The minimal initial and late contributions of Na/K pump inhibition are hardly noticeable on this y-axis scale.
Predicted time-course of changes in RBC pH and system osmolarity following K+ permeabilization
A first set of predictions, totally unsuspected when originally advanced [17], concerned changes in cell and medium pH, with cell acidification and medium alkalinisation (Fig. 2A), predictions experimentally validated in a variety of experimental conditions [18, 47]. Their mechanism is explained in the Discussion. The biphasic time-course predicted for the net H+ flux in this protocol is shown in Fig. 2B. Further scrutiny of csv-file data shows that net K+ flux exceeds net Cl- efflux, and that flux electroneutrality is made up by H+ influx, with the appearance of an electroneutral K+:H+ exchange, misattributed to a real electroneutral K+:H+ antiport in the past [48-50]. Its phantom nature was exposed by the original model which, lacking this transporter, predicted most of the observed experimental results used in its support and explained the complex mechanisms behind its appearance [17]. The non-existing K+:H+ antiport carries instructive cautionary advice on the importance of applying a strict minimalistic approach when building up the model assembly beyond a well-documented set of basic components.
A second set of unexpected predictions concerned system osmolarity (Fig. 2C). The model predicts that cell dehydration driven by net KCl loss elevates cell and medium osmolarity, the result of the power function increase in the osmotic coefficient of haemoglobin with the increase in haemoglobin concentration. The higher the haematocrit of the cell suspension the higher the increase in global system osmolarity as experimentally confirmed [18].
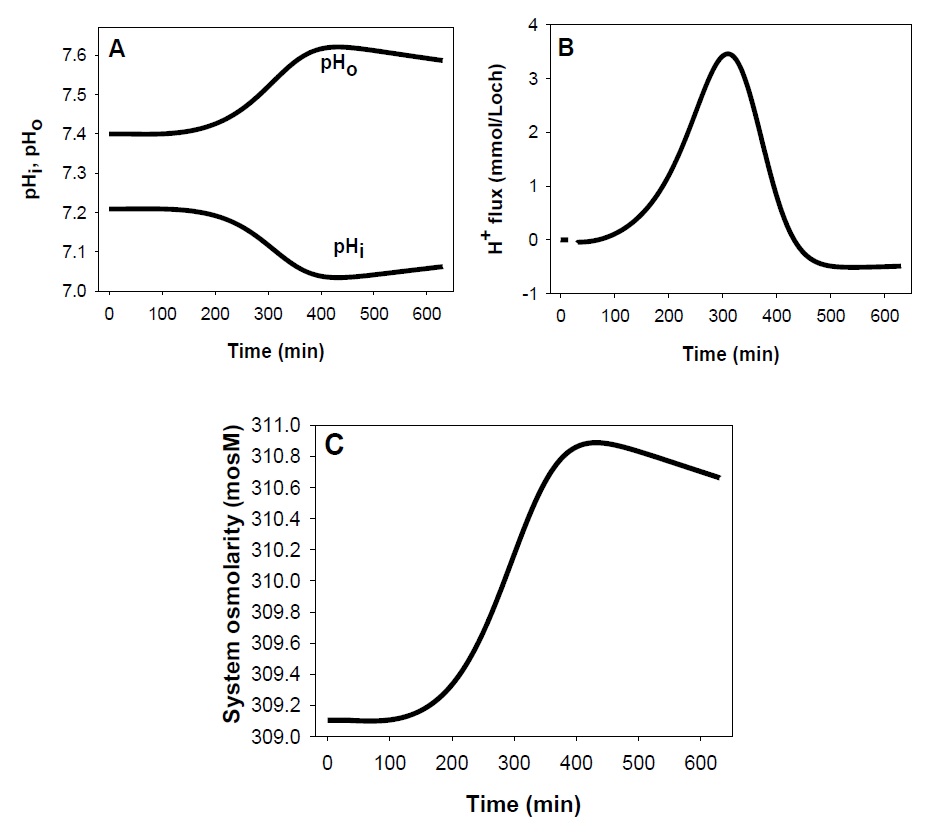
Fig. 2. Predicted changes in pH and system osmolarity following the vanadate protocol. A: Changes in cell and medium pH (pHi and pHo, respectively) with patterns determined by the changes in Cl- concentration ratio, rA, across the red cell membrane; rA = [Cl-]o/[Cl-]i = [HCO3-]o/[HCO3-]i = ([Cl-]o + [ HCO3-]o)/([Cl-]i + [HCO3-]i); B: biphasic H+ flux pattern through the JS mechanism [51, 52] (see Discussion) driven by the changes in rA; C: changes in system osmolarity resulting from variations in haemoglobin crowding secondary to cell volume changes.
To understand the predicted side-effects of Gardos channel activation it is necessary to explain first how protons are transported and buffered in RBCs and how these functions are represented in the model.
The Jacobs-Stewart cycle (JS)The JS cycle [51, 52] comprises the parallel operation of the anion exchanger, AE1, as an electroneutral Cl-:HCO3- antiport, and the CO2 shunt, as illustrated in Fig. 3A.
![Predicted changes in selected RBC variables as a function of time following sudden inhibition of the Na/K and calcium pumps by vanadate. A: relative cell volume changes due to Na/K pump inhibition and to delayed activation of Gardos channels by slow [Ca2+]i gain; B: changes in total ([CaT]i) and free ([Ca2+]i) cytoplasmic calcium concentrations following PMCA inhibition; C: changes in membrane potential, Em, and in the equilibrium potentials of K+ and diffusible anions (A-), EK and EA (EA = ECl = EHCO3), respectively, with time-patterns determined by Gardos channel activation kinetics and by ion gradient dissipation; D: Net K+ flux though the Gardos channel. The biphasic pattern results from changes in the K+ gradient across the plasma membrane. The increasing downhill efflux phase is followed by a decreasing efflux phase as the electrochemical driving gradient of K+ dissipates. The minimal initial and late contributions of Na/K pump inhibition are hardly noticeable on this y-axis scale.](../images/Fig3_2.jpg)
Fig. 3. Representation of the JS cycle as an electroneutral Cl-:H+ symport. A: The Jacobs-Stewart mechanism showing the combined operation of the anion exchanger, AE1, and the CO2 shunt on the transfer of H+ ions across the red cell membrane; B: model-representation of H+ transport through the JS mechanism as an electroneutral Cl-:H+ cotransport.
As a rough approximation to a complex multistep process, we may assume that for each Cl-:HCO3- exchanged through AE1, protonation of the transported HCO3- ion effectively adds a CO2 molecule to the medium on the membrane side it was transported to. Rapid CO2 equilibration across the membrane shunts back the CO2 to the other membrane side releasing a H+ on hydration. The net result of each half JS cycle is therefore the electroneutral transfer of one Cl- with one H+, indistinguishable from the operation of an electroneutral Cl-:H+ symport. Thus, the complete JS cycle may be represented phenomenologically by an electroneutral Cl-:H+ cotransporter, as illustrated in Fig. 3B, ignoring the background roles of HCO3- and CO2.
This phenomenology lumps a large number of steps operating over a vast range of time-scales comprising CO2 solvation, CO2 hydration (spontaneous in the extracellular medium and carbonic anhydrase-assisted intracellularly), CO2 transport, intracellular and extracellular proton buffering, and the complex kinetics of the AE1 exchanger. The Cl-:H+ cotransport representation has been shown to accurately describe the operation of the JS cycle at the functional level required for modelling RBC homeostasis. It allows the model to predict pH changes and explain the mechanisms behind all relevant physiological, pathological and experimental RBC responses involving the participation of the JS cycle [18, 21, 30, 47, 53-58].
An additional important issue addressed by this phenomenology is that of the “ignored” HCO3- and CO2. This oversight, together with the JS cycle phenomenology, also enables the model to be run using a single diffusible anion representation, A‑, for the combined contents or concentrations of Cl- and HCO3-. In most of the experiments with RBC suspensions HCO3- salts are not added to the medium and both HCO3- and CO2 remain unreported as explicit components of the system. Where then is the HCO3- that keeps the Cl-:HCO3- exchange in motion and allows the Cl-:H+ symport phenomenology to represent the operation of the JS system? Dissolved HCO3- at equilibrium with atmospheric CO2 is always present in unsealed cell suspensions, whether declared or not, and its presence is sufficient to sustain near physiological rates of JS cycle turnover. It can easily be estimated that at an atmospheric pressure of 760 mmHg, a ~ 0.04% CO2 in environmental air, a solubility constant of CO2 in water of 0.03mM/mmHg, a pKa of 6.147 for the [H+][HCO3-]/[CO2] hydration reaction, and at a medium pH of 7.4-7.5, the unreported HCO3- concentration will be around 200 μM, more than sufficient to sustain high rates of JS-mediated fluxes.
With over 106 AE1 units per cell and essentially instant CO2 equilibration rates across the RBC plasma membrane, the JS mechanism, optimized by evolution for effective CO2 transport from tissues to lungs, is by far the most important mediator of H+ transport in RBCs. The JS phenomenology is represented in the model by a low-saturation equation of the form FClJS = FHJS = kAE1([Cl-]o [H+]o – [Cl-]i [H+]i), where FClJS and FHJS are the net fluxes of Cl- and H+ through the JS pathway, and kAE1 is the rate constant of AE1 turnover, about four to six orders of magnitude faster than that of any other ion transporter in the RBC membrane (default value in the units used in the RCM: kAE1 = kHA = 2.5*108 h-1). In the absence of net JS fluxes, FJS = 0, [Cl-]o [H+]o = [Cl-]i [H+]i. Defining the concentration ratios rA and rH by rA = [Cl-]o/[Cl-]i and rH = [H+]i/[H+]o, respectively, the equilibrium condition for the JS system at zero net flux will be rA = rH. The participation of other anion and proton transporters causes deviations from this equality, miniscule in normal steady states. Larger deviations during dynamic states would tend to be speedily restored towards rH ≈ rA by the JS system.
A final comment on the use of rA. Because the JS mechanism sets rA = [Cl-]o/[Cl-]i = [HCO3-]o/[HCO3-]i, these equalities extend to rA = ([Cl-]o + [ HCO3-]o)/([Cl-]i + [HCO3-]i). Therefore, depending on the context, rA may refer indistinctly to Cl-, to HCO3-, or to both together, allowing a single rA representation of the diffusible anions in the model (see legend of Fig. 2).
Back to the predicted Gardos channel side-effects
Let us now consider how RBC dehydration caused by K+ permeabilization affects cell pH and osmolarity. As the cells start to dehydrate by the net loss of KCl, four confluent changes among many others are particularly relevant for the pH and osmolarity effects: i) the increased concentration of the non-Hb impermeant intracellular anions lumped under [X-] (Fig. 4A); ii) the increased concentration of haemoglobin (Fig. 4B, [Hb]) and its contribution to the net negative intracellular charge (Fig. 4B, nHb*[Hb]); iii) the osmotic coefficient of haemoglobin, fHb increases along a power function of the haemoglobin concentration [59, 60] increasing sharply the osmotic contribution of haemoglobin as dehydration proceeds (Fig. 4C), and iv), the intracellular concentration of Cl- becomes markedly reduced (Fig. 4A, [Cl-]) by net Cl- loss, by charge displacement from increasingly concentrated impermeant anions X- and Hb‑, and by water retention due to the increasing colloidosmotic pressure on haemoglobin.
The reduction in [Cl-] is the most relevant drive for the pH changes. The resulting increase in rA will tend to be rapidly equilibrated towards rH ≈ rA through the JS mechanism (Fig. 4D), explaining the pH changes shown in Fig. 2A. Although cell acidification is buffered by haemoglobin with reduction in its net negative charge per mol, nHb (Fig. 4B, nHb), the increase in haemoglobin concentration dominates, and its overall contribution to the intracellular negative charge increases with dehydration (Fig. 4B, nHb*[Hb]). The extra osmotic load generated by haemoglobin crowding (Fig. 4C) is rapidly redistributed between cells and medium by an hypertonic KCl + KOH effluent [18]. In Diagram 1 we provide a highly simplified example to illustrate the dehydration-induced acidification mechanism bypassing the complexities generated by macromolecular crowding and proton buffering.
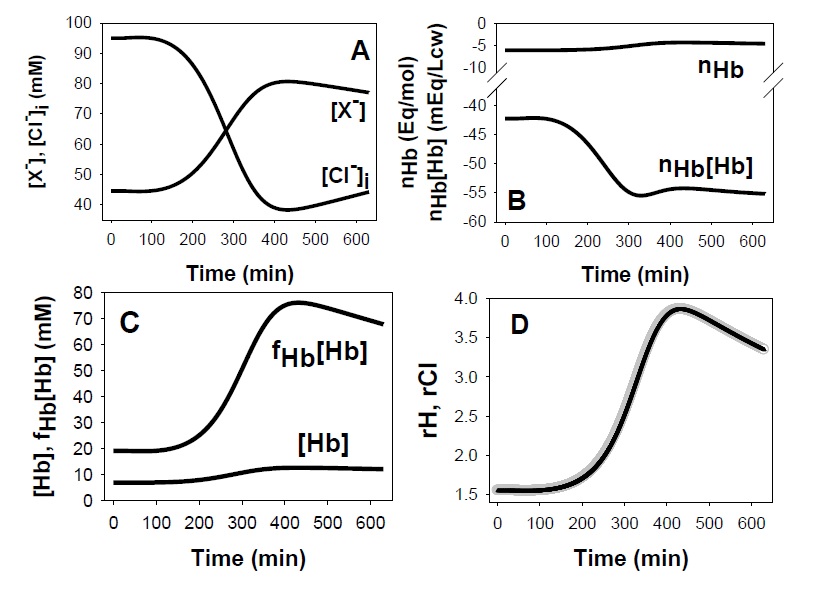
Fig. 4. Predicted effects of macromolecular concentration changes on cell Cl-, H+ and osmolarity. A: Inverse correlation between the changes in the concentrations of cell permeant A- ((Cl-), [Cl-]i) and of impermeant cell anions other than Hb ([X‑]) during the Gardos effect. B: opposite changes in the charge per mole of haemoglobin (nHb) and in the charge concentration on haemoglobin (nHb*[Hb]) during the Gardos effect. C: illustrates the powerful effect of the osmotic coefficient of haemoglobin (fHb) in elevating the osmotic contribution of haemoglobin during concentrative haemoglobin crowding. D: overlapping changes in rA- (gray) and rH+ (black) during the Gardos effect highlighting the almost instant equilibration of rH+ to rA-.
Diagram 1. Thought experiment to illustrate the mechanism by which dehydration by KCl loss acidifies cells that express the anion exchanger (AE1) in their plasma membrane.
The osmotic coefficient of Hb, fHb, follows a power function of the Hb concentration. In the model it is represented with only the two most reliably measured virial coefficients, b and c, fHb = 1 + b*[Hb] + c*[Hb]2 [59-63]. The Hb concentration in RBCs, at a mean of 7.2 mM in physiological conditions, is one of the highest of a soluble protein in nature. As shown in Fig. 4C, although its concentration increases only to about 10 mM on dehydration, its osmotic contribution, estimated from the fHb*[Hb] product, increases almost fourfold, from about 20 to 80 mM forcing a redistribution of membrane permeant solutes to restore osmotic equilibrium between intra- and extra-cellular compartments thus elevating the osmolarity of the RBC suspension as a whole. Haemoglobin crowding (Fig. 2C) has three main side-effects: i) it contributes to increase the net negative charge on impermeant cell anions (Fig. 4B), ii) it elevates cell and system osmolarity (and osmolality) as a power-function of its concentration (Fig. 2C and 4C), and iii) it increases the colloidosmotic pressure within the cells causing water retention and a progressively more hypertonic effluent as part of the redistribution process of permeant ions between cells and medium (Fig. 2C). It tempts speculation that this powerful osmotic effect of soluble protein crowding, so easily detectable in a RBC suspension, may yet be discovered to participate in the fluid dynamics of cells containing compartments with high local concentrations of soluble macromolecules.
We can now summarize the sequence of events during the Gardos Effect (Fig. 5). Running down of cell ATP by the combination of substrate and inhibitor reduces Ca2+ extrusion by the plasma membrane calcium pump. This allows a net build-up of the intracellular concentration of free calcium to levels that activate Gardos channels (Fig. 1B and 1D). The cell hyperpolarizes to potentials intermediate between those of EK and ECl (Fig. 1C) driving a net loss of KCl. As the cells dehydrate, the intracellular chloride concentration progressively declines (Fig. 4A), driving a net entry of chloride and protons through the Jacobs-Stewart mechanism, with cell acidification and medium alkalinisation (Fig. 2A and 4D). Concurrently, dehydration progressively increases the osmotic contribution of haemoglobin along a power function (Fig. 4E), elevating its colloidosmotic strength, causing water retention and the generation of a progressively hypertonic effluent with overall increase in system osmolarity (Fig. 2C), higher the higher the haematocrit of the cell suspension. Water retention, in turn, contributes to intracellular chloride dilution, an additional contributor to the overall pH change via rA.
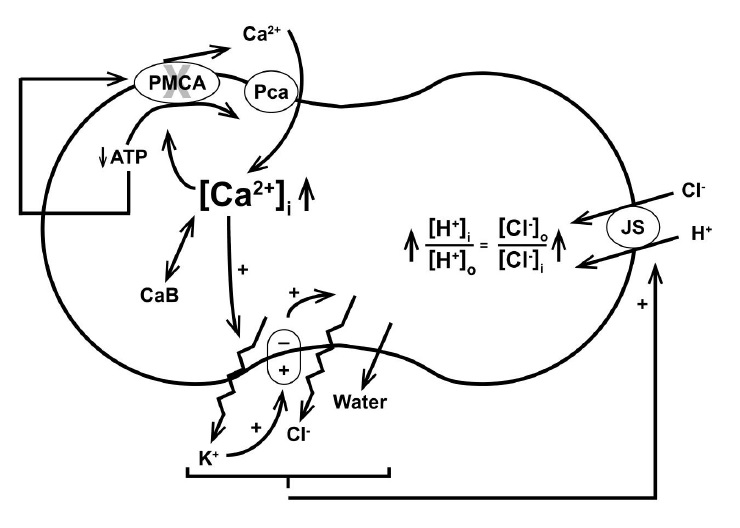
Fig. 5. Illustration of the sequence of effects triggered by the Gardos effect, leading from ATP depletion to cell dehydration and acidification. CaB: buffered calcium. Bottom oval: membrane potential, Em. Full description in the text.
Dedication: To the memory of Alexey Vereninov.
I am grateful to Alan Kay for insightful comments and suggestions on an early draft of the manuscript.
Gardos G: The function of calcium in the potassium permeability of human erythrocytes. Biochim Biophys Acta 1958;30:653-654.
https://doi.org/10.1016/0006-3002(58)90124-0Gardos G: Effect of ethylenediaminetetraacetate on the permeability of human erythrocytes. Acta Physiol Acad Sci Hung 1958;14:1-5.
Gardos G: The role of calcium in the potassium permeability of human erythrocytes. Acta Physiol Acad Sci Hung 1959;15:121-125.
Lew VL: On the ATP dependence of the Ca2+-induced increase in K+ permeability observed in human red cells. Biochim Biophys Acta 1971;233:827-830.
https://doi.org/10.1016/0005-2736(71)90185-4Lew VL: Effect of ouabain on the Ca2+-dependent increase in K+ permeability in depleted guinea-pig red cells. Biochim Biophys Acta 1971;249:236-239.
https://doi.org/10.1016/0005-2736(71)90100-3Lew VL, Ferreira HG: Calcium transport and the properties of a calcium-activated potassium channel in red cell membranes; in Kleinzeller A, Bronner F (eds): Current Topics in Membranes and Transport, Vol 10, Academic Press, NY, 1978, pp 217-277.
https://doi.org/10.1016/S0070-2161(08)60836-9Schatzmann HJ: ATP-dependent Ca++-extrusion from human red cells. Experientia 1966;22:364-365.
https://doi.org/10.1007/BF01901136Zambo B, Varady G, Padanyi R, Szabo E, Nemeth A, Lango T, Enyedi A, Sarkadi B: Decreased calcium pump expression in human erythrocytes is connected to a minor haplotype in the ATP2B4 gene. Cell Calcium 2017;65:73-79.
https://doi.org/10.1016/j.ceca.2017.02.001Rogers S, Lew VL: PIEZO1 and the mechanism of the long circulatory longevity of human red blood cells. PLoS Comput Biol 2021;17:e1008496.
https://doi.org/10.1371/journal.pcbi.1008496Rogers S, Lew VL: Up-down biphasic volume response of human red blood cells to PIEZO1 activation during capillary transits. PLoS Comput Biol 2021;17:e1008706.
https://doi.org/10.1371/journal.pcbi.1008706Bookchin RM, Lew VL: Effect of a 'sickling pulse' on calcium and potassium transport in sickle cell trait red cells. J Physiol 1981;312:265-280.
https://doi.org/10.1113/jphysiol.1981.sp013628Lew VL, Bookchin RM: Ion transport pathology in the mechanism of sickle cell dehydration. Physiol Rev 2005;85:179-200.
https://doi.org/10.1152/physrev.00052.2003Lew VL, Ortiz OE, Bookchin RM: Stochastic nature and red cell population distribution of the sickling-induced Ca2+ permeability. J Clin Invest 1997;99:2727-2735.
https://doi.org/10.1172/JCI119462Gnanasambandam R, Rivera A, Vandorpe DH, Shmukler BE, Brugnara C, Snyder LM, Andolfo I, Iolascon A, Silveira PA, Hamerschlak N, Gottlieb P, Alper SL: Increased Red Cell KCNN4 Activity in Sporadic Hereditary Xerocytosis Associated With Enhanced Single Channel Pressure Sensitivity of PIEZO1 Mutant V598M. Hemasphere 2018;2:e55.
https://doi.org/10.1097/HS9.0000000000000055Fermo E, Bogdanova A, Petkova-Kirova P, Zaninoni A, Marcello AP, Makhro A, Hanggi P, Hertz L, Danielczok J, Vercellati C, Mirra N, Zanella A, Cortelezzi A, Barcellini W, Kaestner L, Bianchi P: 'Gardos Channelopathy': a variant of hereditary Stomatocytosis with complex molecular regulation. Sci Rep 2017;7:1744.
https://doi.org/10.1038/s41598-017-01591-wRivera A, Vandorpe DH, Shmukler BE, Gallagher DR, Fikry CC, Kuypers FA, Brugnara C, Snyder LM, Alper SL: Erythrocytes from hereditary xerocytosis patients heterozygous for KCNN4 V282M exhibit increased spontaneous Gardos channel-like activity inhibited by senicapoc. Am J Hematol 2017;92:E108-E110.
https://doi.org/10.1002/ajh.24716Lew VL, Bookchin RM: Volume, pH, and ion-content regulation in human red cells: analysis of transient behavior with an integrated model. J Membr Biol 1986;92:57-74.
https://doi.org/10.1007/BF01869016Freeman CJ, Bookchin RM, Ortiz OE, Lew VL: K-permeabilized human red cells lose an alkaline, hypertonic fluid containing excess K over diffusible anions. J Membrane Biol 1987;96:235-241.
https://doi.org/10.1007/BF01869305Swietach P, Tiffert T, Mauritz JM, Seear R, Esposito A, Kaminski C, Lew VL, Vaughan-Jones RD: Hydrogen ion dynamics in human red blood cells. J Physiol 2010;588:4995-5014.
https://doi.org/10.1113/jphysiol.2010.197392Lew VL, Freeman CJ, Ortiz OE, Bookchin RM: A mathematical model of the volume, pH, and ion content regulation in reticulocytes. Application to the pathophysiology of sickle cell dehydration. J Clin Invest 1991;87:100-112.
https://doi.org/10.1172/JCI114958Bookchin RM, Ortiz OE, Lew VL: Evidence for a direct reticulocyte origin of dense red cells in sickle cell anemia. J Clin Invest 1991;87:113-124.
https://doi.org/10.1172/JCI114959Lew VL, Tiffert T, Ginsburg H: Excess hemoglobin digestion and the osmotic stability of Plasmodium falciparum-infected red blood cells. Blood 2003;101:4189-4194.
https://doi.org/10.1182/blood-2002-08-2654Tosteson DC: Regulation of cell volume by sodium and potassium transport; in Hoffman JF (ed): The Cellular Functions of Membrane Transport. Englewood Cliffs, NJ, Prentice Hall, 1964, pp 3-22.
Funder J, Wieth JO: Potassium, sodium, and water in normal human red blood cells. Scand J Clin Lab Invest 1966;18:167-180.
https://doi.org/10.3109/00365516609051812Beauge L, Lew VL: Passive fluxes of sodium and potassium across red cell membranes; in Ellory JC, Lew VL (eds): Membrane Transport in Red Cells. London, Academic Press, 1977, pp 39-51.
Lew VL, Tiffert T: On the Mechanism of Human Red Blood Cell Longevity: Roles of Calcium, the Sodium Pump, PIEZO1, and Gardos Channels. Front Physiol 2017;8:977.
https://doi.org/10.3389/fphys.2017.00977Dasanna AK, Fedosov DA, Gompper G, Schwarz US: State diagram for wall adhesion of red blood cells in shear flow: from crawling to flipping. Soft Matter 2019;15:5511-5520.
https://doi.org/10.1039/C9SM00677JSvetina S, Svelc Kebe T, Bozic B: A Model of Piezo1-Based Regulation of Red Blood Cell Volume. Biophys J 2019;116:151-164.
https://doi.org/10.1016/j.bpj.2018.11.3130Mauritz JM, Esposito A, Ginsburg H, Kaminski CF, Tiffert T, Lew VL: The homeostasis of Plasmodium falciparum-infected red blood cells. PLoS Comput Biol 2009;5:e1000339.
https://doi.org/10.1371/journal.pcbi.1000339Waldecker M, Dasanna AK, Lansche C, Linke M, Srismith S, Cyrklaff M, Sanchez CP, Schwarz US, Lanzer M: Differential time-dependent volumetric and surface area changes and delayed induction of new permeation pathways in P. falciparum-infected hemoglobinopathic erythrocytes. Cell Microbiol 2017;19:e12650.
https://doi.org/10.1111/cmi.12650Lew VL, Ferreira HG, Moura T: The behaviour of transporting epithelial cells. I. Computer analysis of a basic model. Proc R Soc London B 1979;206:53-83.
https://doi.org/10.1098/rspb.1979.0091Hills A, Chen ZH, Amtmann A, Blatt MR, Lew VL: OnGuard, a computational platform for quantitative kinetic modeling of guard cell physiology. Plant Physiol 2012;159:1026-1042.
https://doi.org/10.1104/pp.112.197244Jezek M, Hills A, Blatt MR, Lew VL: A constraint-relaxation-recovery mechanism for stomatal dynamics. Plant Cell Environ 2019;42:2399-2410.
https://doi.org/10.1111/pce.13568Minguet-Parramona C, Wang Y, Hills A, Vialet-Chabrand S, Griffiths H, Rogers S, Lawson T, Lew VL, Blatt MR: An Optimal Frequency in Ca2+ Oscillations for Stomatal Closure Is an Emergent Property of Ion Transport in Guard Cells. Plant Physiol 2016;170:33-42.
https://doi.org/10.1104/pp.15.01607Vialet-Chabrand S, Hills A, Wang Y, Griffiths H, Lew VL, Lawson T, Blatt MR, Rogers S: Global Sensitivity Analysis of OnGuard Models Identifies Key Hubs for Transport Interaction in Stomatal Dynamics. Plant Physiol 2017;174:680-688.
https://doi.org/10.1104/pp.17.00170Svetina S: Relations among variations in human red cell volume, density, membrane area, hemoglobin content and cation content. J Theor Biol 1982;95:123-134.
https://doi.org/10.1016/0022-5193(82)90291-0Lew VL, Raftos JE, Sorette M, Bookchin RM, Mohandas N: Generation of normal human red cell volume, hemoglobin content, and membrane area distributions by "birth" or regulation? Blood 1995;86:334-341.
https://doi.org/10.1182/blood.V86.1.334.bloodjournal861334Tiffert T, Lew VL: Elevated intracellular Ca2+ reveals a functional membrane nucleotide pool in intact human red blood cells. J Gen Physiol 2011;138:381-391.
https://doi.org/10.1085/jgp.201110660Cantley LC, Jr., Josephson L, Warner R, Yanagisawa M, Lechene C, Guidotti G: Vanadate is a potent (Na,K)-ATPase inhibitor found in ATP derived from muscle. J Biol Chem 1977;252:7421-7423.
https://doi.org/10.1016/S0021-9258(17)40978-1Tiffert T, Lew VL: Kinetics of inhibition of the plasma membrane calcium pump by vanadate in intact human red cells. Cell Calcium 2001;30:337-342.
https://doi.org/10.1054/ceca.2001.0241Lew VL, Tsien RY, Miner C, Bookchin RM: The physiological [Ca2+]i level and pump-leak turnover in intact red cells measured with the use of an incorporated Ca chelator. Acta Physiologica Latino Americana 1982;32:220-221.
Tiffert T, Lew VL: Cytoplasmic Ca2+ buffers in intact human red cells. J Physiol 1997;500:139-154.
https://doi.org/10.1113/jphysiol.1997.sp022005Ferreira HG, Lew VL: Use of ionophore A23187 to measure cytoplasmic Ca buffering and activation of the Ca pump by internal Ca. Nature 1976;259:47-49.
https://doi.org/10.1038/259047a0Hunter MJ: Human erythrocyte anion permeabilities measured under conditions of net charge transfer. J Physiol 1977;268:35-49.
https://doi.org/10.1113/jphysiol.1977.sp011845Glogowska E, Dyrda A, Cueff A, Bouyer G, Egee S, Bennekou P, Thomas SL: Anion conductance of the human red cell is carried by a maxi-anion channel. Blood Cells Mol Dis 2010;44:243-251.
https://doi.org/10.1016/j.bcmd.2010.02.014Thomas SL, Bouyer G, Cueff A, Egee S, Glogowska E, Ollivaux C: Ion channels in human red blood cell membrane: actors or relics? Blood Cells Mol Dis 2011;46:261-265.
https://doi.org/10.1016/j.bcmd.2011.02.007Swietach P, Tiffert T, Mauritz JM, Seear R, Esposito A, Kaminski CF, Lew VL, Vaughan-Jones RD: Hydrogen ion dynamics in human red blood cells. J Physiol 2010;588:4995-5014.
https://doi.org/10.1113/jphysiol.2010.197392Cala PM: Cell volume regulation by Amphiuma red blood cells. The role of Ca+2 as a modulator of alkali metal/H+ exchange. J Gen Physiol 1983;82:761-784.
https://doi.org/10.1085/jgp.82.6.761Cala PM: Volume regulation by Amphiuma red blood cells. The membrane potential and its implications regarding the nature of the ion-flux pathways. J Gen Physiol 1980;76:683-708.
https://doi.org/10.1085/jgp.76.6.683Hoffmann EK, Simonsen LO: Membrane mechanisms in volume and pH regulation in vertebrate cells. Physiol Rev 1989;69:315-382.
https://doi.org/10.1152/physrev.1989.69.2.315Jacobs MH, Stewart DR: The role of carbonic anhydrase in certain ionic exchanges involving the erythrocyte. J Gen Physiol 1942;25:539-552.
https://doi.org/10.1085/jgp.25.4.539Jacobs MH, Stewart DR: Osmotic properties of the erythrocyte. XII. Ionic and osmotic equilibria with a complex external solution. J Cell Comp Physiol 1947;30:79-103.
https://doi.org/10.1002/jcp.1030300106Hladky SB, Rink TJ: pH equilibrium across the red cell membrane, in Ellory JC, Lew VL (eds): Membrane transport in Red Cells. London, Academic Press, 1977, pp 115-135.
Jarvis HG, Gore DM, Briggs C, Chetty MC, Stewart GW: Cold storage of 'cryohydrocytosis' red cells: the osmotic susceptibility of the cold-stored erythrocyte. Br J Haematol 2003;122:859-868.
https://doi.org/10.1046/j.1365-2141.2003.04487.xRaftos JE, Lew VL: Effect of intracellular magnesium on calcium extrusion by the plasma membrane calcium pump of intact human red cells. J Physiol 1995;489:63-72.
https://doi.org/10.1113/jphysiol.1995.sp021030Tiffert T, Etzion Z, Bookchin RM, Lew VL: Effects of deoxygenation on active and passive Ca2+ transport and cytoplasmic Ca2+ buffering in normal human red cells. J Physiol 1993;464:529-544.
https://doi.org/10.1113/jphysiol.1993.sp019649Etzion Z, Tiffert T, Bookchin RM, Lew VL: Effects of deoxygenation on active and passive Ca2+ transport and on the cytoplasmic Ca2+ levels of sickle cell anemia red cells. J Clin Invest 1993;92:2489-2498.
https://doi.org/10.1172/JCI116857Staines HM, Ellory JC, Kirk K: Perturbation of the pump-leak balance for Na+ and K+ in malaria- infected erythrocytes. Am J Physiol Cell Physiol 2001;280:C1576-C1587.
https://doi.org/10.1152/ajpcell.2001.280.6.C1576Adair GS: Thermodynamic analysis of the observed osmotic pressures of protein salts in solutions of finite concentration. Proc R Soc London A 1929;126:16-24.
https://doi.org/10.1098/rspa.1929.0199McConaghey PD, Maizels M: The osmotic coefficients of haemoglobin in red cells under varying conditions. J Physiol 1961;155:28-45.
https://doi.org/10.1113/jphysiol.1961.sp006611Solomon AK, Toon MR, Dix JA: Osmotic properties of human red cells. J Membrane Biol 1986;91:259-273.
https://doi.org/10.1007/BF01868819Freedman JC, Hoffman JF: Ionic and osmotic equilibria of human red blood cells treated with nystatin. J Gen Physiol 1979;74:157-185.
https://doi.org/10.1085/jgp.74.2.157Hirschfelder JO, Curtiss CF, Bird RB: Molecular theory of gases and liquids, ed 2. New York, Wiley, 1964.