Review - DOI:10.33594/000000613
Accepted 23 February, 2023 - Published online : 15 March 2023
1Department of Biological Sciences, Kent State University, Kent, Ohio, USA;
2Gatsby Computational Neuroscience Unit, University College London, London, UK;
3Department of Biomedical Engineering, Northwestern University, Evanston, Illinois, USA
The positive charge on the major intracellular inorganic cations (K+, Na+, and Mg2+) significantly exceeds the combined negative charge on Cl- and HCO3-. This so-called anion gap must be balanced by organic anions. From the analysis of published data, we conclude that organic phosphorus-containing compounds (Po) are responsible for the neutralization of much of the anion gap. Importantly, many of them are large polymers, such as DNA, RNA, or polyphosphate, that undergo regular synthesis and degradation. That produces a variable average valency z associated with organic anions. It follows from theory that an increase in z should lead to membrane hyperpolarization and accumulation of cations: this result has been known before, and here we further confirm it by an analysis based on different cellular and computational models. Furthermore, we show that inhibition of potassium channels is expected to reduce the uptake of phosphorus through sodium-coupled transporters. This suggests a simple explanation to two long-established experimental facts about DNA synthesis: namely, that it is accompanied by cell hyperpolarization and that it requires functional potassium channels.
Intracellular fluid contains more inorganic cations than inorganic anions, creating an “anion gap” (AG) [1]. This term usually refers to the difference between the major positive and negative ions in blood plasma but could be equally applied to the cell interior. Thus, we define anion gap as the difference between the positive and negative charges on the most abundant permeant ions: potassium, sodium, and chloride. We also add magnesium to the balance, whose total concentration (mostly in the bound form) is 15-20 mM in mammalian cells [2]; the contribution of bicarbonate is typically on the order of 10 mM [3, 4]. Thus,
(Here and subsequently, all the concentrations are intracellular, unless indicated otherwise with a subscript “e”, for extracellular). The typical value of the anion gap in mammalian cells is about 0.1 M (Table 1). Such an excess of positive charges, if not neutralized by other ions, would create exceedingly strong electric forces that cannot be sustained. Therefore, the deficit of inorganic anions must be compensated by organic anions.
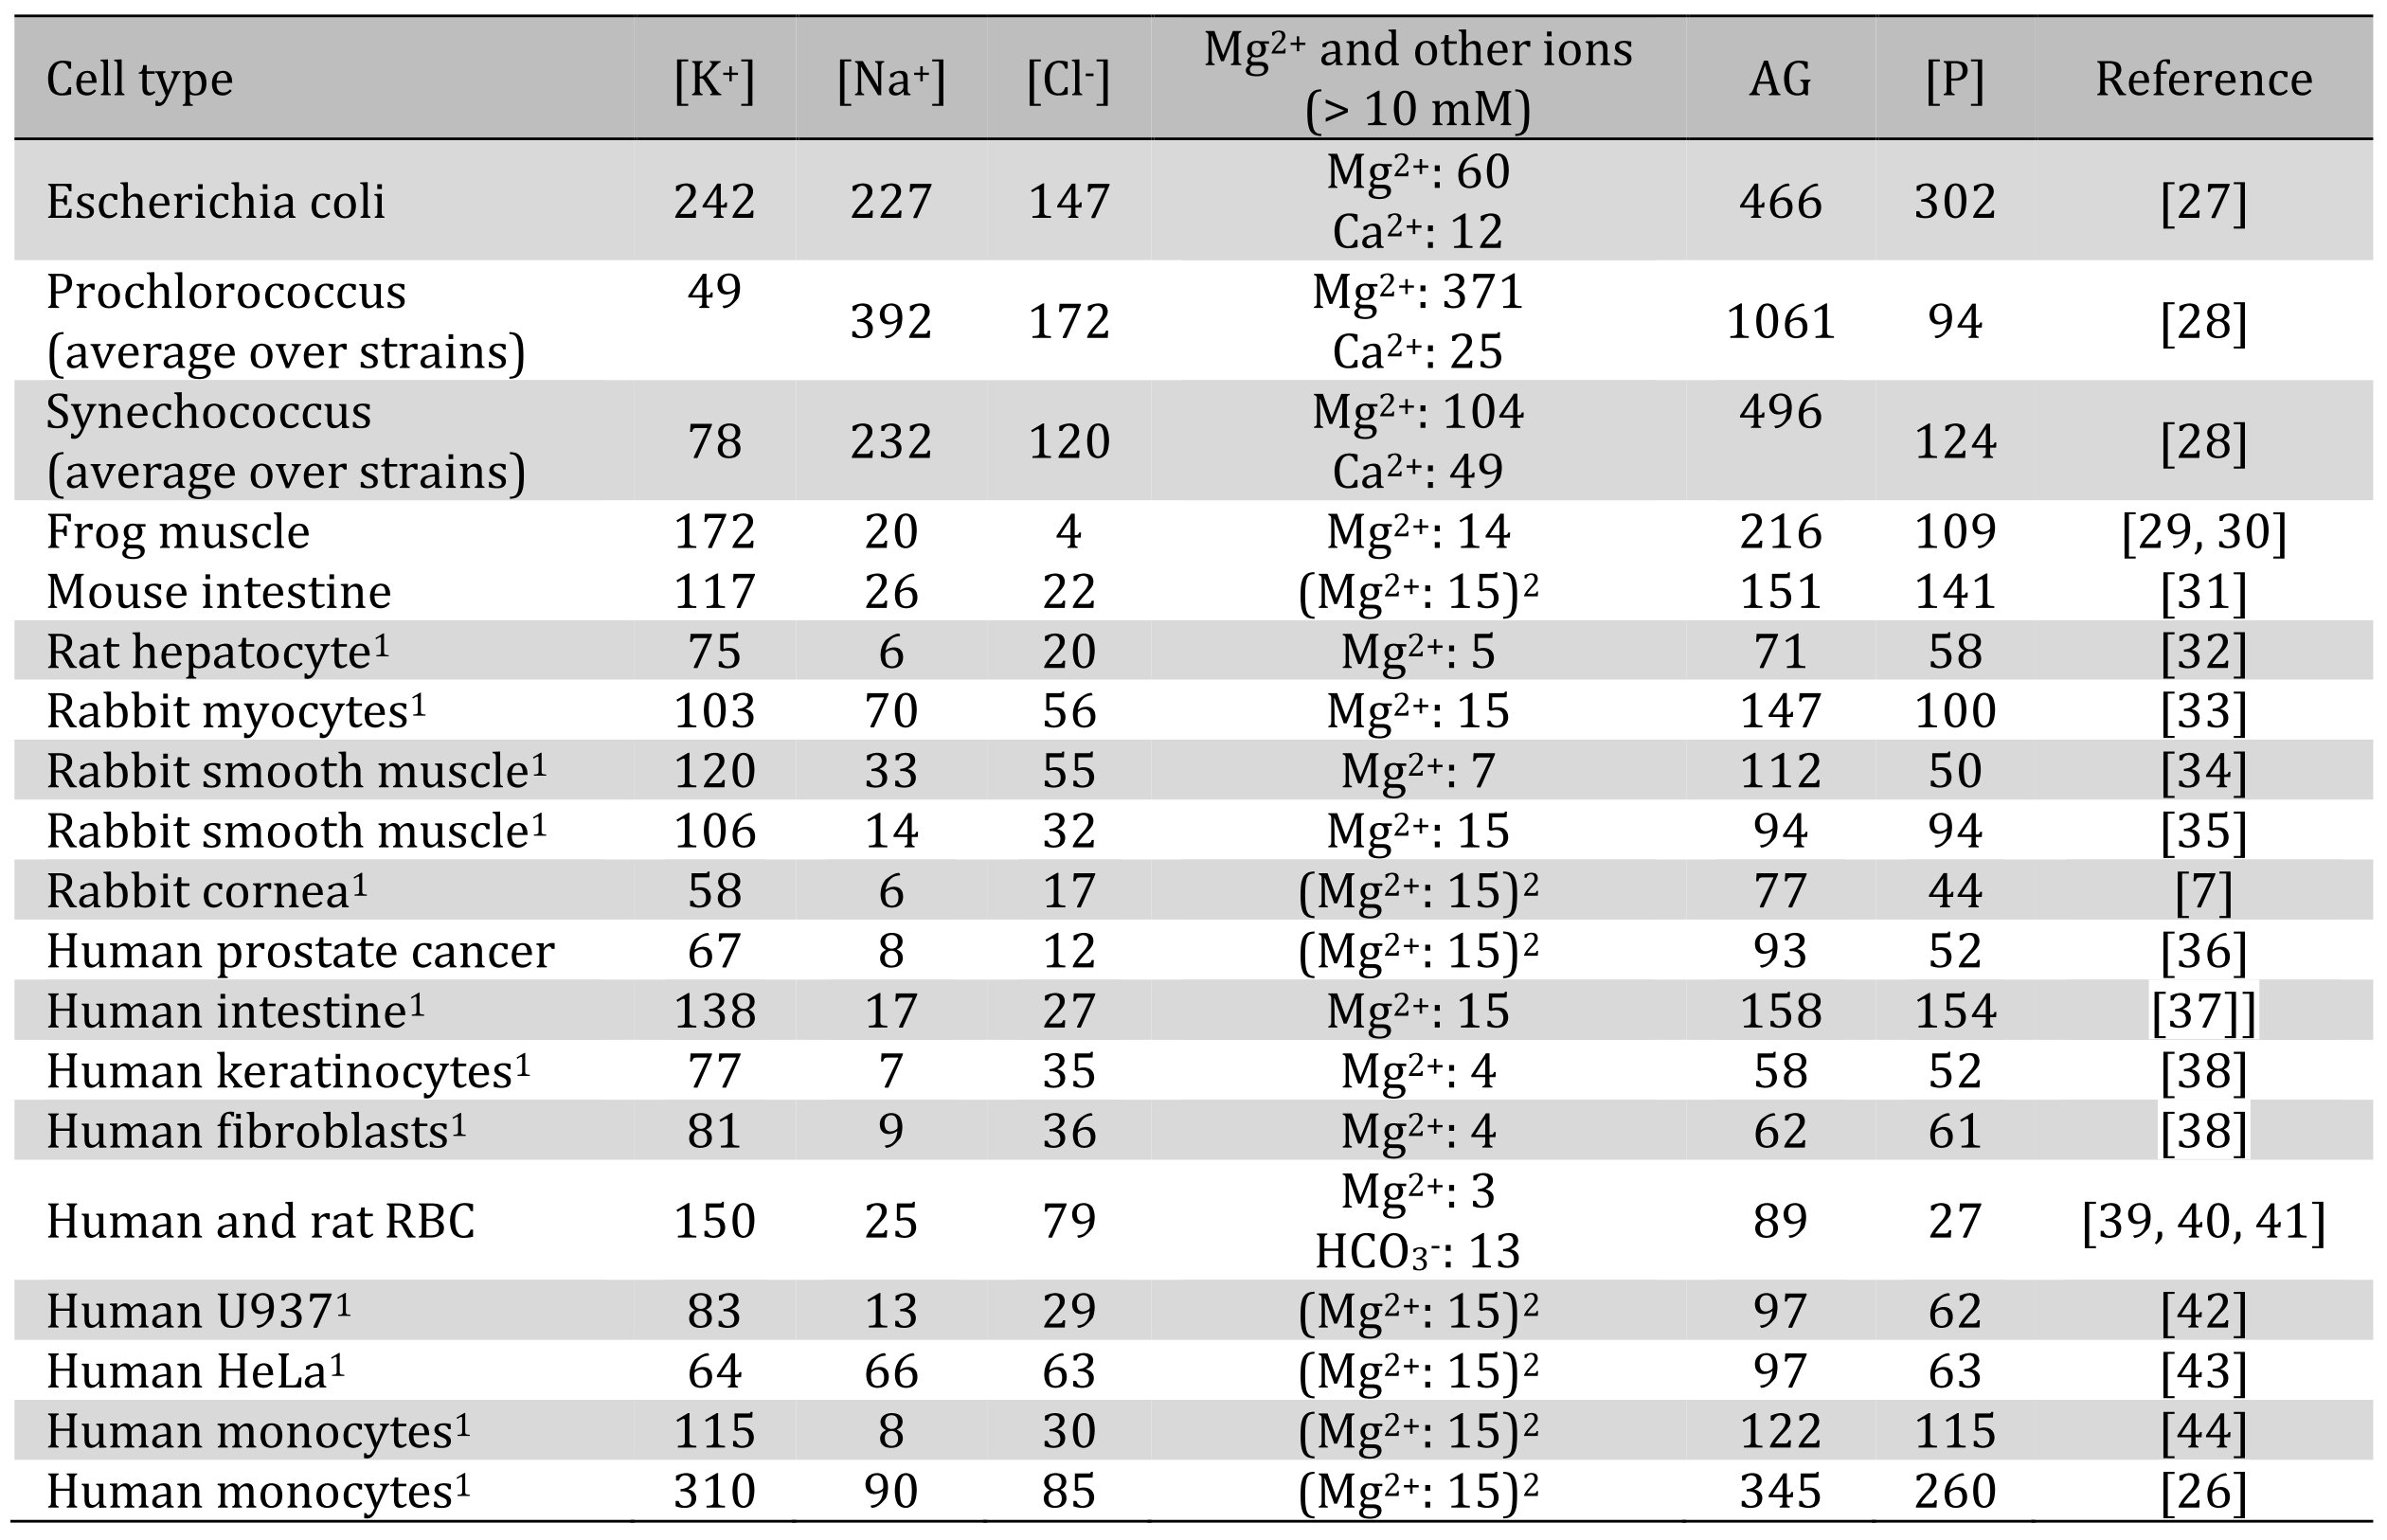
Table 1. Intracellular concentrations of the major ions and phosphorus in mmol/L in whole cells. Most measurements have been performed by atomic spectroscopy. 1Concentration were recalculated from mmol/kg dry weight data, assuming 0.3 kg dry weight/L for bacteria and 0.2 kg dry weight/L for mammalian cells. 2Total magnesium concentration was not reported and was assumed to be 15 mM [2]. The values for AG may be further corrected for intracellular bicarbonate, whose concentration in the human muscle is estimated at 10 mM [3, 4]
In theoretical treatments, the diverse organic constituents of the cell are often treated as a single impermeant pool with average molar concentration [Xz-] and average valency -z; the magnitudes of [Xz-] and z are chosen to maintain approximate iso-osmolarity with the external medium and electroneutrality. Although the organic composition of diverse cell types has been broadly characterized [5, 6, 7], the exact origin of z remains uncertain; it has only been evaluated to some extent in highly specialized cells, such as erythrocytes and muscle cells [8, 9, 10]. It seems that most authors believe that the anion gap is mainly balanced by anionic proteins, but phosphorus-containing compounds are also recognized as another possible source of negative charge [8, 11, 12, 13, 14, 15]. In any event, this question and its implications have not been thoroughly analyzed. Indeed, the electric charge of the entire proteome is difficult to assess, and it would be challenging to create an accurate “balance sheet” of intracellular charges due to their diversity. On the other hand, intracellular phosphorus can be measured by atomic emission spectroscopy or by X-ray microanalysis, which can help to make crude estimates.
The other likely reason for the paucity of studies of impermeant ions is that they are often viewed as a static background in the events played out by the mobile inorganic ions. However, the impermeability of “impermeant” anions does not necessarily imply that their amount never changes, as they can gradually accumulate or are broken down and released into the environment.
Cell volume regulation provides a vivid example. The typical experiment involves abruptly replacing the cell medium with a hypotonic or hypertonic solution and observing the ensuing changes in cell volume, intracellular ions, or membrane potential. Many cell types restore their volume after the initial and inevitable osmotic swelling or shrinkage, often recovering within minutes or tens of minutes. It has been shown, both theoretically and experimentally, that this rapid volume restoration is caused by the redistribution of the major permeant ions: potassium, sodium, and chloride [16, 17, 18]. Sometimes, bicarbonate [19, 20, 21] or easily permeant organic osmolytes [22] are brought into the picture as well.
Long-term osmotic adaptation is different from the response to acute osmotic shock [23]. In particular, the constantly changing cell volume can hardly serve as a set point in growing and dividing cells, and there is evidence that cells are guided by the density of the dry mass instead (or the equivalent measure of cell water content) [24, 25]. No osmolytes can be considered unalterable during slow processes, and their role in cell regulation must be examined.
We will start by reviewing the available experimental data to identify the major sources of impermeant anions; we will try to make a case that organic phosphate-based anions (which, by analogy with the standard symbol Pi for inorganic phosphates, we denote with Po) provide the bulk of the requisite negative charge. Significantly, accumulation or dissipation of Po has been found to correlate with the membrane potential. This correlation is explained in the third, theoretical part of the paper, where we show that an increase in z (i.e., due to the synthesis of nucleic acids) is expected to hyperpolarize the cell and increase the intracellular concentration of cations, in direct agreement with experiment.
Organic phosphates Po
A limited compilation of the available data on intracellular ion and phosphorus concentrations is given in Table 1. Despite a spread in the data, the anion gap in mammalian cells is consistently on the order of 100-150 mM with only one major outlier noted [26].As stated earlier, the two main hypotheses posit that the deficit of anions must be matched by proteins and/or Po. It appears from Table 1 that the molar amounts of intracellular phosphorus in mammalian cells are equivalent, on average, to three quarters of the anion gap. Since phosphorus in biological fluids is always charged and exists as a mixture of single- and double-charged anions [45], neutralization of inorganic cations must be largely due to phosphorus.
Phosphorus is delivered to the cells as inorganic phosphate Pi in the form of H2PO4- and HPO42- through sodium-coupled transporters. The main phosphate importers in the human are type II, bringing in one ion of HPO42- along with two or three Na+ ions, and type III, with the stoichiometry 2Na+/H2PO4-. The driving force for these cotransporters utilizes the Na+ gradient, but their exact regulation is not understood. Additionally, transporter activity may be modulated by changes in [K+], pH, and hormones, including parathyroid hormone [46, 47]. The efflux of Pi is largely carried out by Xenotropic and Polytropic Retrovirus Receptor 1 (XPR1) [46].
The major intracellular forms of phosphorus include nucleic acids, anionic phospholipids (phosphatidic acid, phosphatidylserine, and phosphatidylinositol), phosphorylated proteins, polyphosphate in bacteria, inorganic phosphate, nucleotides, and diverse small metabolites (such as creatine phosphate in the muscle). The important question, however, is not only which species neutralize the anion gap but whether their amount undergoes significant variability, affecting other physiological aspects of the cell. Of these, DNA and RNA seem to be the most variable or, at any rate, variable in the most obvious ways. But first, we will briefly review the other compounds.
2a. Nucleotides. Inorganic phosphate and adenine nucleotides are typically present at a concentration of several mM, with ATP4- and Pi being more abundant than ADP and AMP [48]. However, ATP is always complexed with Mg2+, making it essentially Mg-ATP2-; the remaining two charges are presumably balanced by Na+ and K+. The conversion between ATP, ADP, and Pi is not expected to produce an immediate change in net negative charge. However, the amount of Pi that is consumed or released in the course of these reactions, and especially its maximum concentration, is tightly regulated by membrane transporters [49], and therefore one can expect that ATP synthesis from ADP and Pi would slightly increase both z and [Xz-], and ATP hydrolysis would decrease them.
One situation in which ATP varies significantly under normal conditions is the circadian rhythm, when ATP exhibits a peak during the night [50, 51]. During the same period, the suprachiasmatic nucleus neurons become hyperpolarized [52]. Although this fact by itself does not prove anything (the observed correlation could be due to the simple activation of the Na+-K+ pump by ATP [53]), it is at least compatible with the notion that accumulation of charged phosphate molecules shifts the membrane potential toward more negative values.
2b. Polyphosphate. Bacteria, yeast, and mammalian platelets contain large amounts of polyphosphate – a linear polymer made of hundreds or thousands of phosphate residues [49]. Polyphosphate accumulates in response to amino acid starvation [54] and is stored in the organelles known as acidocalcisomes. The concentration of polyphosphate within acidocalcisomes can reach molar levels; their very large negative charge is compensated by magnesium, calcium, sodium, zinc, and basic amino acids [55].
It is difficult to directly relate the membrane potential to polyphosphate, as its accumulation (which would presumably drive the membrane potential toward hyperpolarization) occurs under adverse conditions, when the membrane potential could be affected by other factors. Nevertheless, B. subtilis were found to be slightly hyperpolarized after a 7-day starvation compared to exponentially growing cultures [56], which, again, agrees with the hypothesis that accumulation of phosphorus in a polymeric form favors hyperpolarization.
2c. Phosphorylated proteins. A third of all proteins contain covalently bound phosphate, and many of them express multiple phosphorylation sites [57, 58]. Thus, phosphorylated proteins can carry a substantial negative charge. It is less clear whether this charge by itself serves any significant regulatory function, as the activity of ion channels is affected by phosphorylation, and that can have a more direct impact on ions and membrane potential. For example, inhibition of phosphatases with okadaic acid causes an increase in the Ca2+current [59], which can easily mask the nonspecific effect of impermeant charges.
2d. Phospholipids. The overall negative membrane potential has two origins: the bulk processes, such as the pump-leak mechanism, and anionic phospholipids within the plasma membrane [60, 61, 62]. Although the existence of the latter type of potential is well established, little is known about its regulation, and it will not be the focus of this paper. Phospholipids are also present in intracellular compartments, where their influence on the potential across the plasma membrane should be qualitatively similar to that of other impermeant anions. Of anionic phospholipids, phosphatidic acid and phosphatidylserine carry a charge of -1, and only phosphatidylinositol has a much larger z of -4. The most active synthesis of phospholipids coincides with the S phase of the cell cycle [63].
2e. Nucleic acids. We can estimate the contribution of DNA to the phosphate pool and the overall negative charge. DNA or dsRNA contain 3 nmol of phosphate per μg [64]. Since the ,diploid amount of human DNA per cell is 6 pg (BioNumbers), the molar amount of phosphate is 18 fmol per cell. Therefore, a diploid cell with volume V μm3 will have 18/V mol/L of phosphate due to DNA. Table 2 lists some typical amounts of cell-averaged phosphorus concentration contained in nucleic acids.
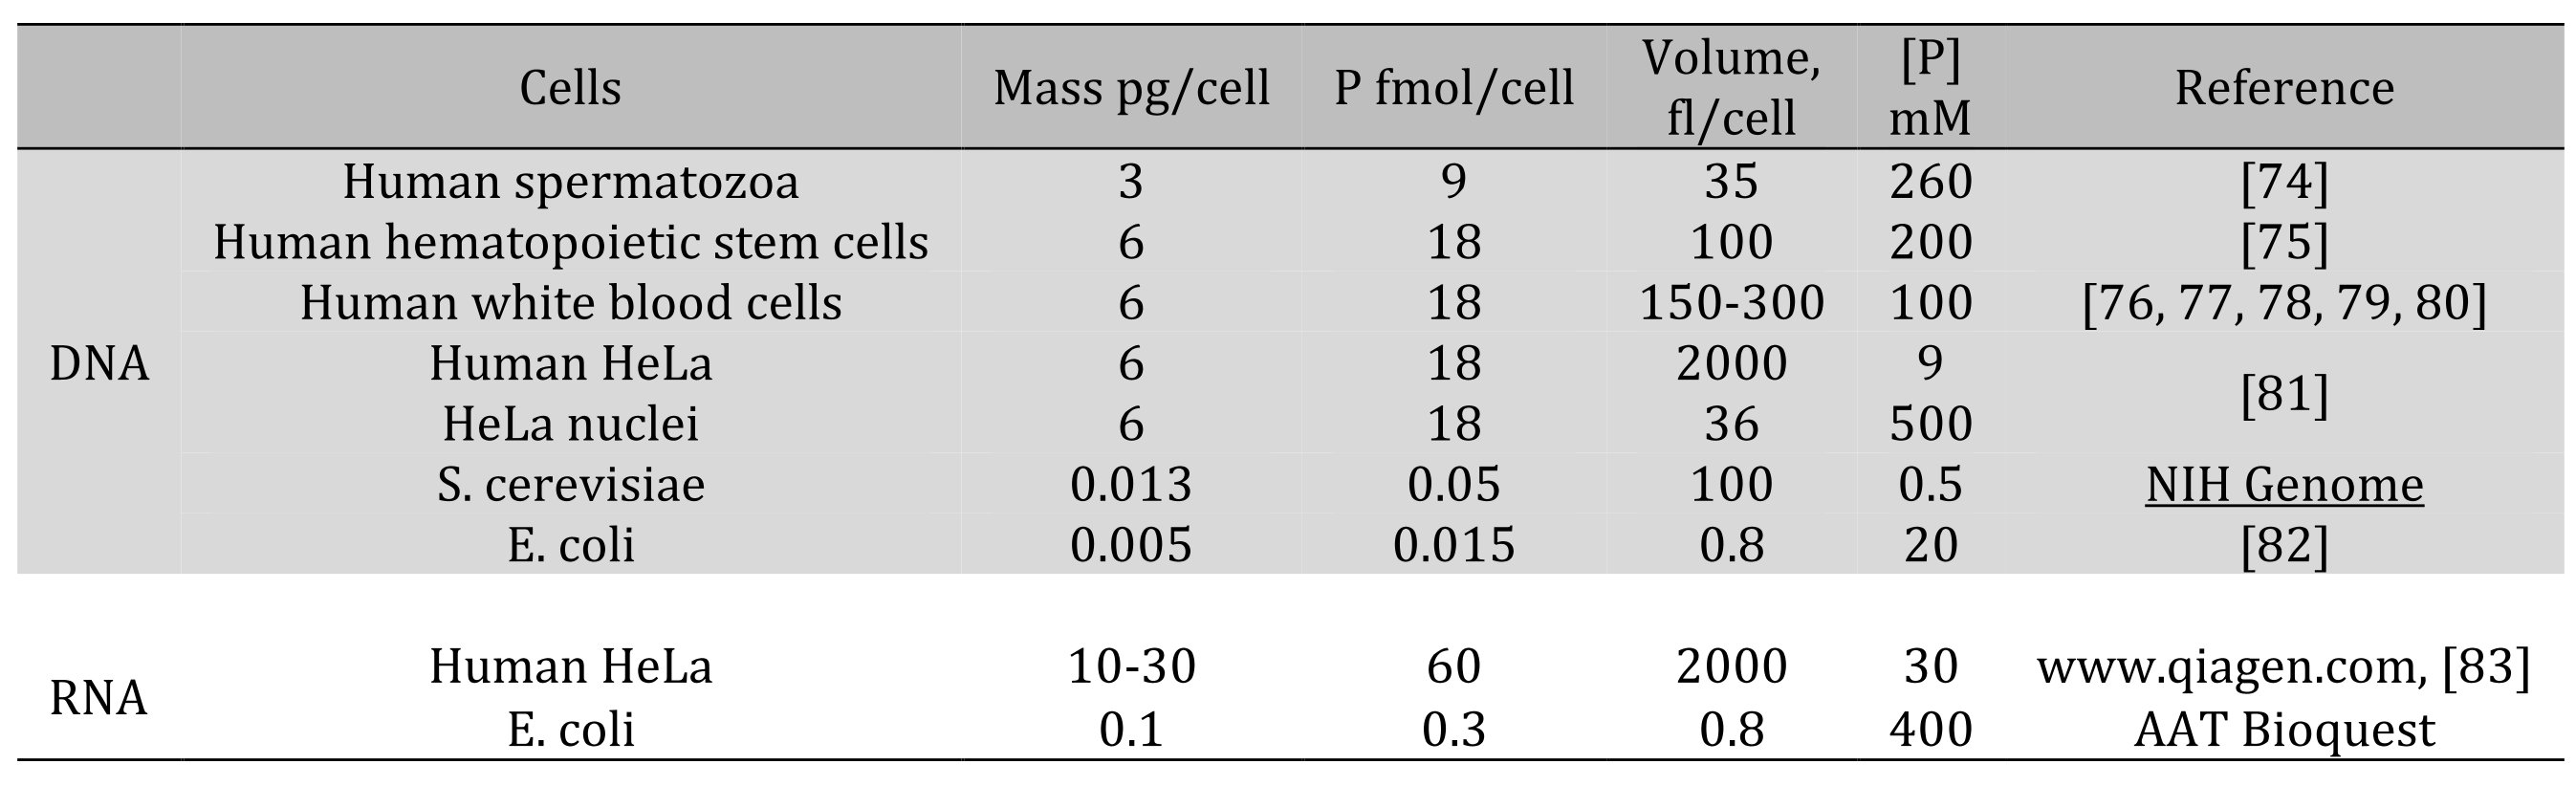
Table 2. Cell-averaged concentrations of DNA and RNA-associated phosphorus
The conversion of concentrations into charge equivalents requires some caution. Although each phosphate group in nucleic acids is fully ionized with charge -1 [65], approximately half of that charge is neutralized by positively charged histones [66; A. Onufriev, personal communication]. The remaining charge is compensated by potassium and sodium [67, 68].
Sperm cells are an exception, as histones are largely replaced in them with protamine. As far as we know, the extent of charge compensation by protamine has not been evaluated, but its contribution must be significant because a large increase in the phosphorus content of the nucleus over that in the midpiece or the tail is not matched by a similar increase in cations [69, 70].
RNA makes another large pool of Po, and the amount of RNA correlates with DNA and protein synthesis [71, 72, 73]. However, the role of RNA as an impermeant anion is harder to assess because of the existence of different types of RNA and multiple RNA-binding proteins.
The correlation between DNA synthesis and membrane potential has been well established [84]. Cells experience hyperpolarization during the S and G2 phases relative to G1 [85, 86, 87]; moreover, hyperpolarization seems to be a requirement for the S phase initiation. Conversely, depolarization of the plasma membrane accompanies the G2/M transition.
Likewise, the correlation between K+ and the phase of the cell cycle has been demonstrated multiple times ([88, 89; reviewed in [90]). Since different types of K+ channels can support proliferation, one may hypothesize that their activation is secondary to the more universal event of proliferation, namely, the accumulation of phosphates. Interestingly, RNA synthesis does not depend on potassium [89].
Negatively charged proteins
While databases of isoelectric points of proteins and proteomes are available [91], less is known about the exact values of the protein charge z. As a crude approximation, we estimated the charge on a 100-amino acid protein with composition corresponding to the prevalence of amino acids in vertebrates (Amino Acid Frequency). For that purpose, we used the computational tool available on Protein Tool. We estimated that the charge of such a protein will be z = 1.6 electron units (negative, as is assumed elsewhere in the text); thus, assuming 200 mg/ml of protein in a mammalian cell (which may be a slight overestimation of its concentration because not all cellular dry matter consists of protein) and an average molecular weight of amino acids of 110 Da, proteins are expected to contribute about 30 mM of negative charge to the cell. It should be noted that the estimation of protein charge based on amino acid sequences are not always reliable ([92] and references therein).
More specific data are scarce. There has been a large study of 30 amino acid-long segments from different organisms [93], but the published data do not allow a simple conversion to average z. The latter can only be evaluated with some confidence in a few cases. Proteins in E. coli have an average charge of 14.4 electrons/protein [94]. Assuming 2.4x10⁶ protein molecules per cell with an average volume of 0.8 μm3 [95; 96], one obtains 70 mM of equivalent charges. This can be compared to 200 mM of phosphorus measured in E. coli [97]. Even a greater predominance of phosphorus over negative proteins is found in Saccharomyces cerevisiae. The reported volumes of yeast cells have ranged from 40 μm3 [98] to 90 μm3 [99] to 300 μm3 [100], but that would not affect the comparison between proteins and phosphorus. For z = 3.6 [94] and 50x106 protein molecules per cell [101], one obtains 0.18 billion electron equivalents on proteins and 44 times more (7.9 billion) equivalents on phosphorus [102]. Naturally, a somewhat different picture emerges for red blood cells that lack nucleic acids. Inorganic phosphate, ATP, and 2,3-diphosphoglycerate make up around 10 mM total concentration [103; 104]. The net negative charge on a hemoglobin molecule has been estimated between z = 14 from amino acid composition [105] and 5 from osmotic properties [106, 107]. At a concentration 0.34 g/ml = 5.3 mM, the concentration of electron equivalents on hemoglobin is almost an order of magnitude higher than on phosphates, namely, 75 mM or 26 mM, depending on which estimate for z is used (incidentally, the first estimate closely matches the AG value of 89 mM listed in Table 1).
Heterogeneous distribution of impermeant and permeant ions
Elements, including ions, are distributed within the cell highly heterogeneously [108]. First, we wish to point out that the presence of electric fields may compromise the accuracy or measurements of local ion concentrations using fluorescent probes, because the thermodynamic activity of the ion and possibly of the probe and/or the probe-ion complex will be affected by the same fields. The same reservations apply to electrode-based measurements. This potentially important practical question deserves further study. Atomic spectroscopy is a more direct way to quantify intracellular elements.
The experimental data on sodium and potassium concentrations in the nucleus vs. cytoplasm have been variable. Moore and Morrill [109] cite several studies, in which nuclear sodium and potassium were much elevated over those in the cytoplasm. The data of other authors have been less consistent (Table 3). Data on rat hepatocytes in three different publications or on rat neurons in two publications contain numbers that differ by two, three-, or even five-fold. This may indicate some difficulties with X ray microanalysis or just natural variability in ion content. One possible source of variability is the heterogeneous nature of the nucleus: phosphorus and potassium concentrations are significantly higher in condensed chromatin than in the nucleoplasm [110]. The good match between the AG and phosphorus observed in many cases seems to contradict the notion that histones compensate half of the DNA negative charge (see above). However, because of the presence of variable but significant amounts of RNA in the nucleus [111], one cannot attribute all the nuclear phosphorus to DNA alone.
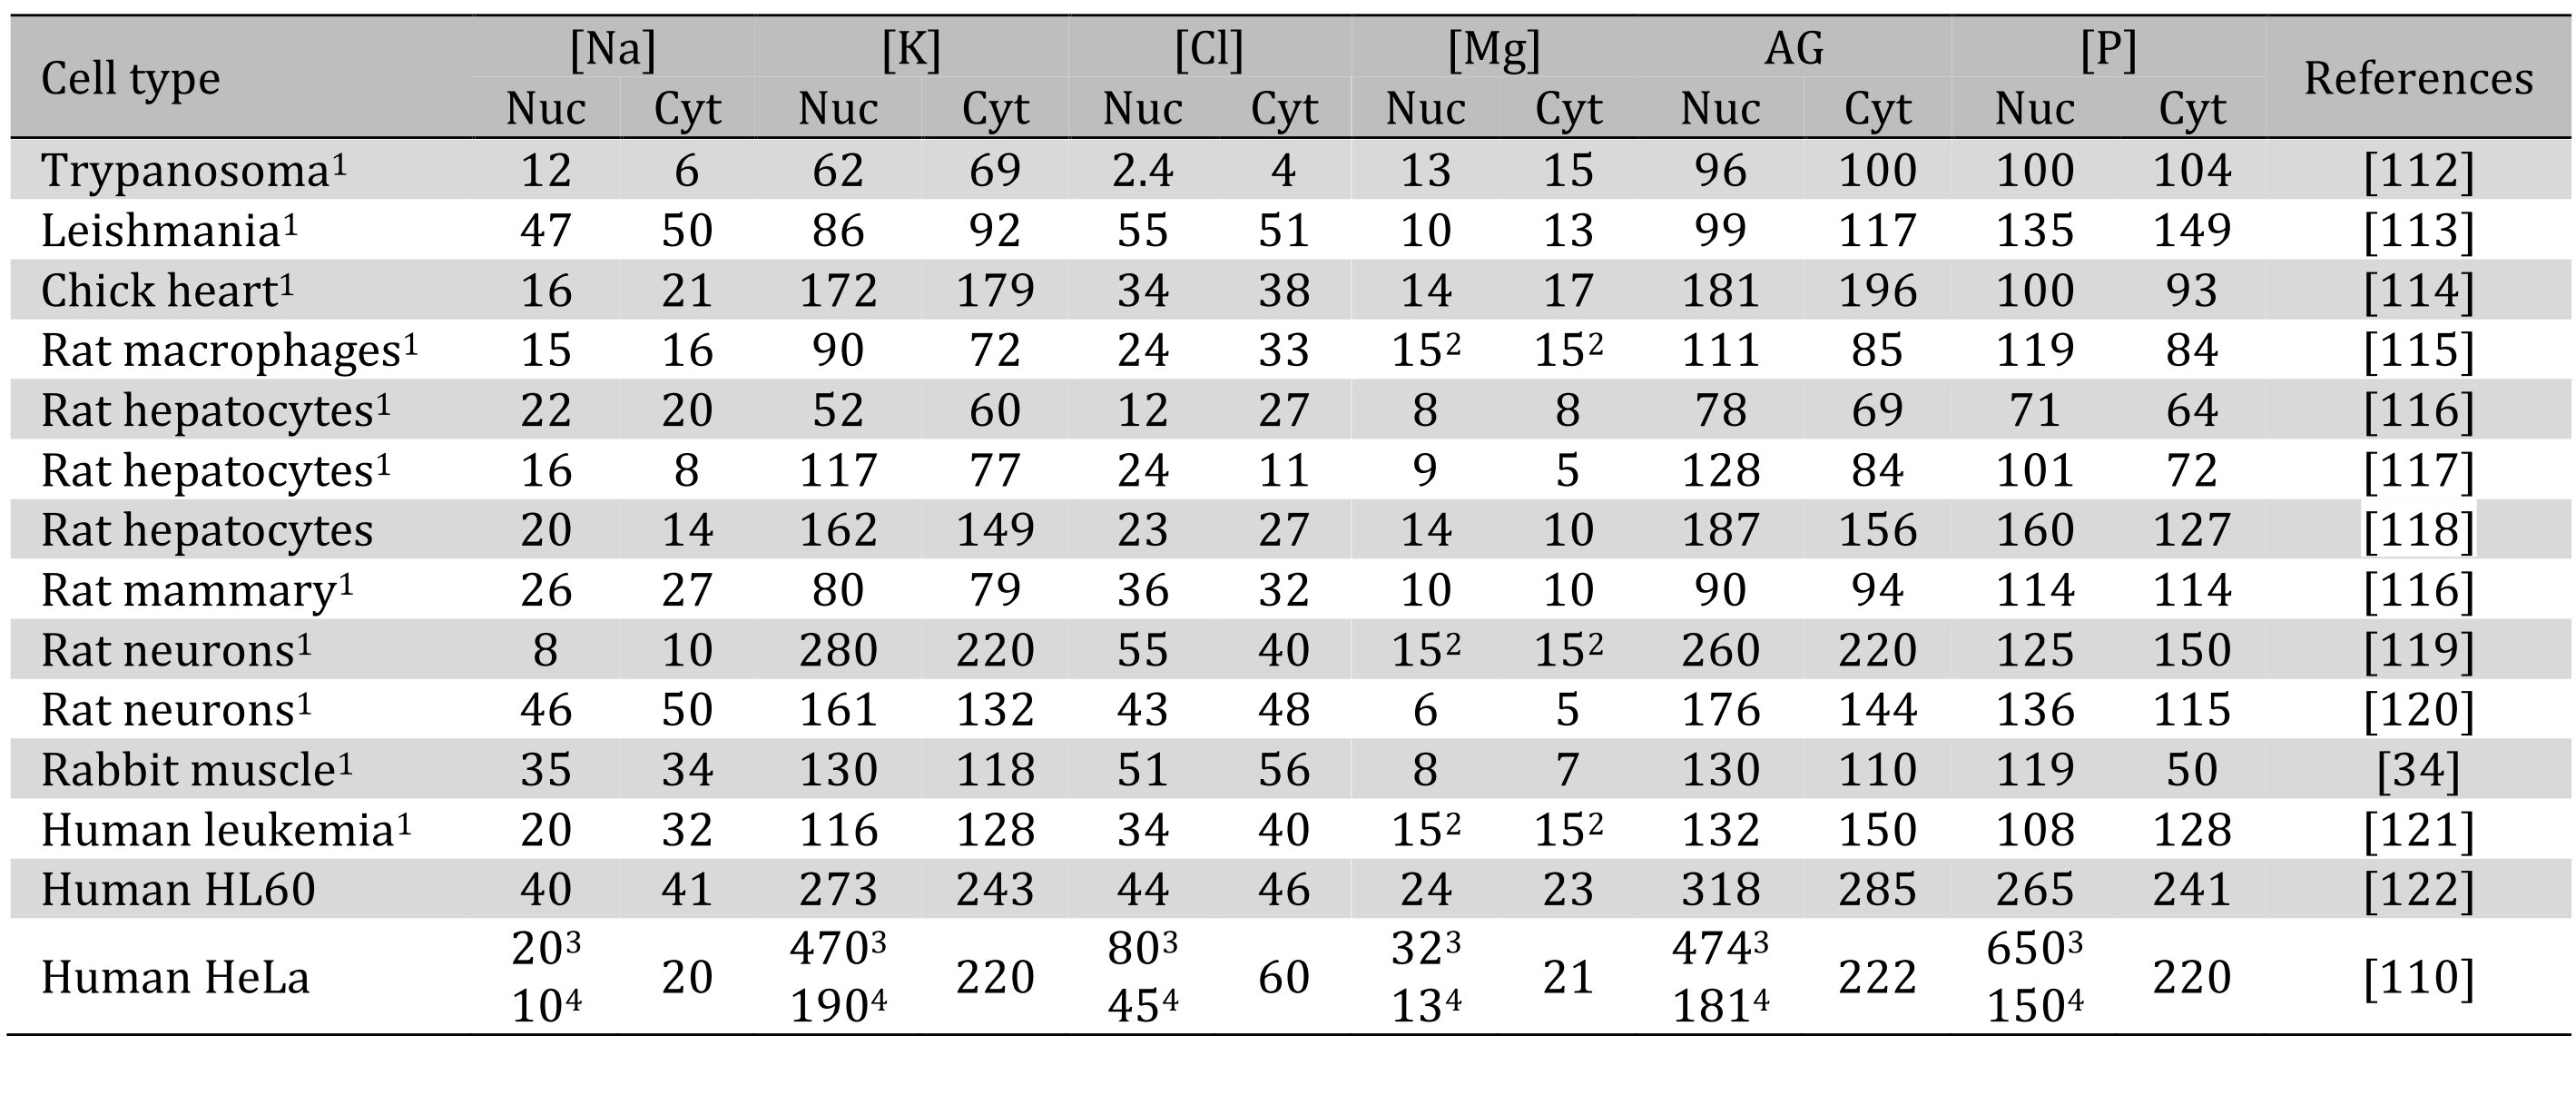
Table 3. Intracellular concentrations in mmol/L of the major ions and phosphate in nuclei and cytoplasm. 1Concentration were recalculated from mmol/kg dry weight data assuming 0.2 kg dry weight/L in mammalian cells. 2Total magnesium concentration was not reported and was assumed to be 15 mM [2]. 3Condensed chromatin. 4Nucleoplasm
Here we will theoretically examine the effect of large multivalent organic anions, such as DNA, on intracellular ions and membrane potential. The synthesis of molecules, such as DNA, from nucleotides mainly results in an increase in the average z. Table 2 lists a few examples of DNA and RNA concentrations, which sometimes significantly exceed the typical ~10 mM of nucleotides and Pi. This effect is especially prominent in smaller nucleated cells, such as hematopoietic cells. In such cells, the doubling of DNA will result in almost the doubling of z.
Model A [123]. In this model based on Keener and Sneyd [15], a spherical cell with surface area A and volume V is bathed in a solution with known and constant sodium, potassium, and chloride concentrations and osmolarity P. The cell interior contains variable amounts of potassium, sodium, and chloride, and a constant amount of impermeant anions Xz- with average valency -z. Passive ion fluxes into and out of the cell are quantified through the analog of Ohm’ law, in which the driving force Y is represented as the difference between the membrane potential ψ and the equilibrium Nernst potential for a given ion. In the case of potassium and sodium, the flux through the Na+-K+ pump is added. For example, the flux equation for sodium has the form
where S is the constant contribution of the Na+-K+ pump, and the membrane permeability for sodium is included in the coefficient q. Chloride transport is taken as entirely passive and uncoupled from other ions. These conditions provide three equations (one for each ion) for five unknowns: three intracellular ion concentrations, cell volume, and membrane potential. One of the remaining two equations needed to solve the system relates the rate of volume change to the osmolarity difference: the rate of water accumulation is proportional to membrane permeability (included in the coefficient k) and the difference between the internal and external osmolarity:
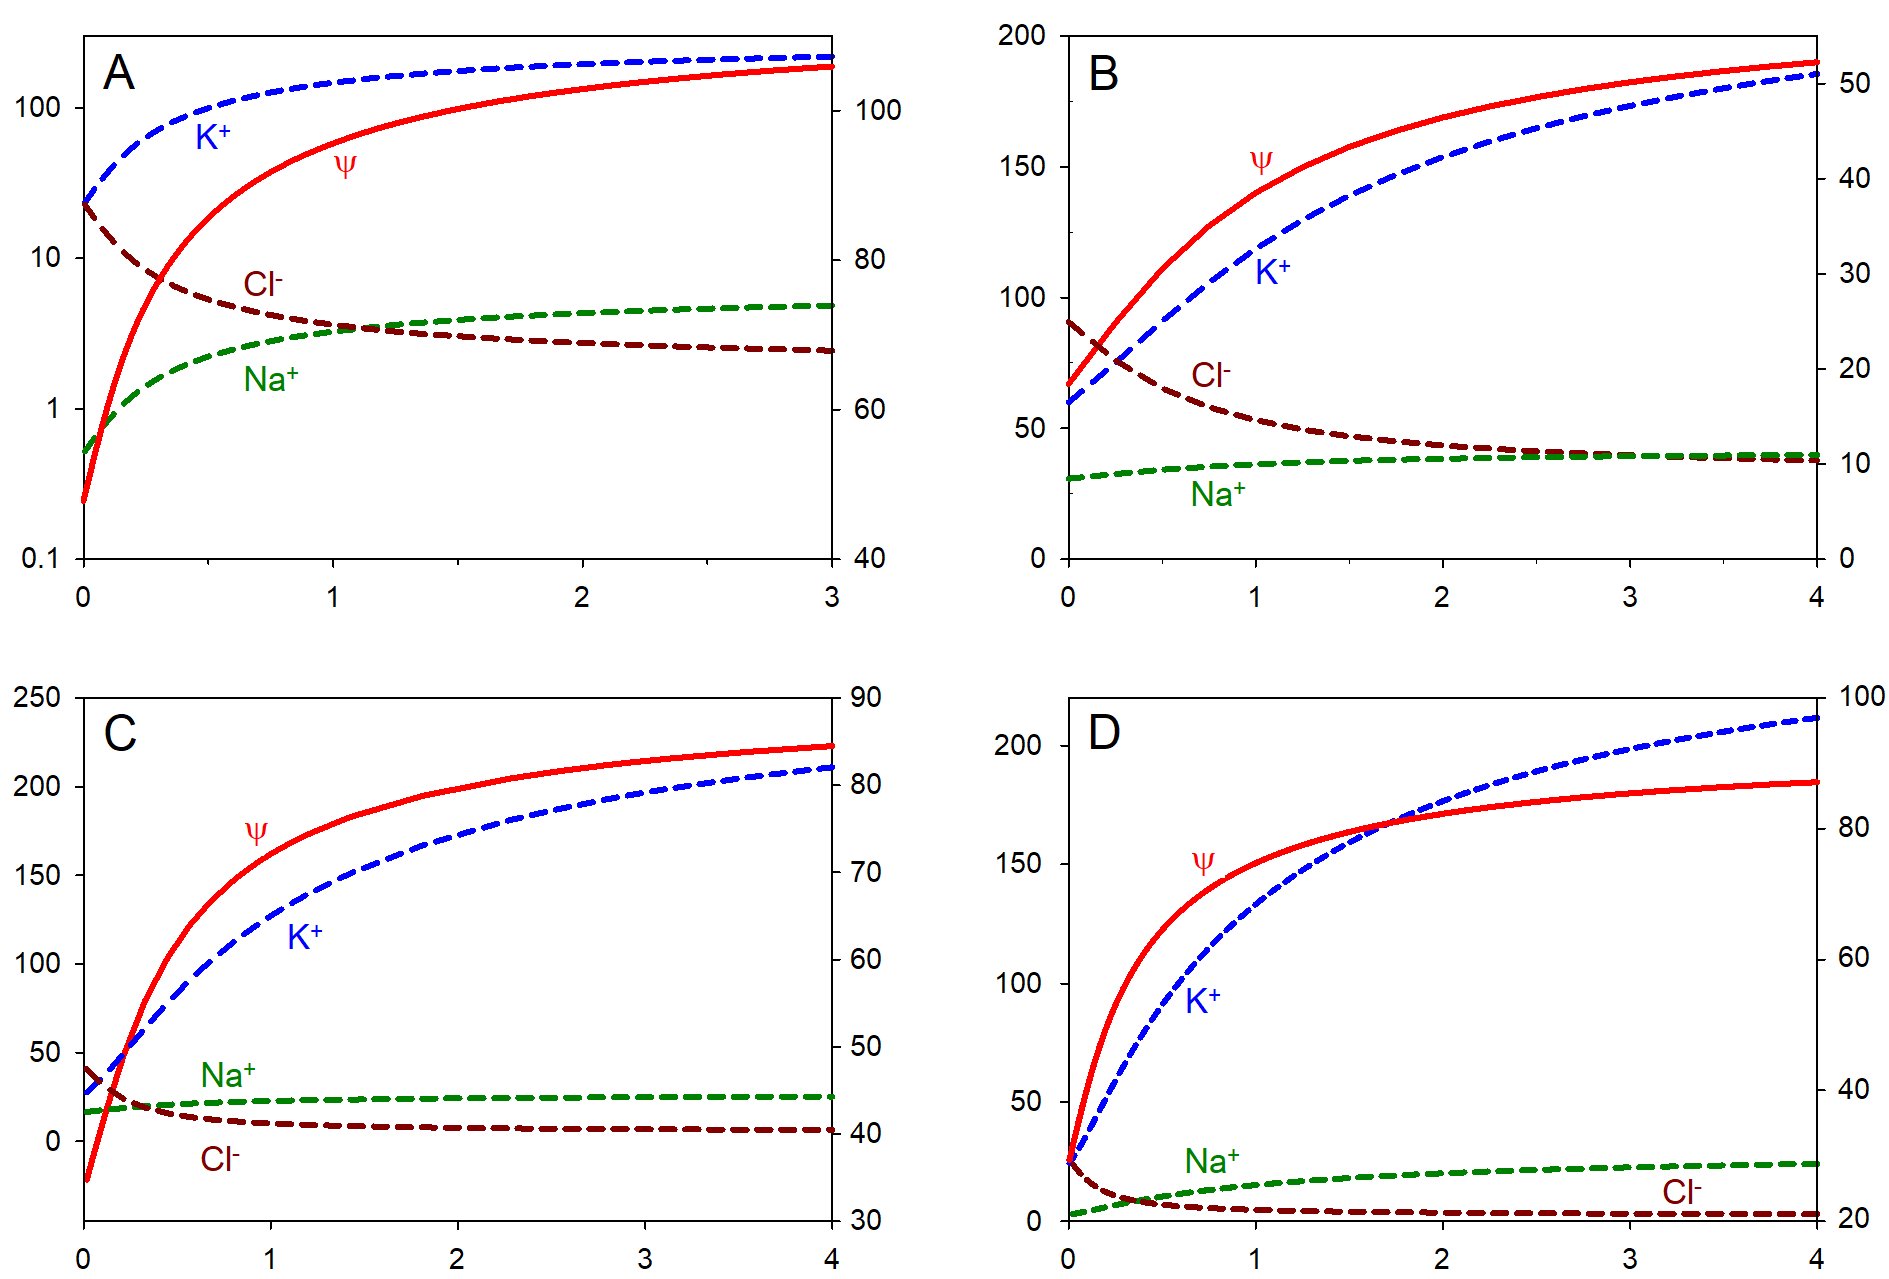
Figure 1. Theoretical effects of z on cellular parameters based on Models A-D. The absolute values of z (which are negative) are plotted on the horizontal axes. The red lines show the absolute values of the negative membrane potential ψ in mV (right vertical axes); the dashed lines show the stabilized concentrations of intracellular ions in mM (left vertical axes): potassium (blue), sodium (green), and chloride (dark red). The data in panel A are replotted from [109]). In all cases, an increase in z leads to hyperpolarization, accumulation of cations, and loss of chloride. Notice an increasing anion gap in the right side of graphs, which is compensated by a correspondingly larger z.
The other equation relates ψ to the difference between positive and negative charges using the “charge difference” approach [124]:
where F is the Faraday constantand C is the specific membrane capacitance.
The above set of five equations allows one to find the dependency of ψ and ion concentrations on z. The results for steady state are shown in Fig. 1A. An increase in the negative valency z of impermeant charges produces hyperpolarization (more negative ψ), as well as accumulation of potassium and sodium and a loss of chloride. It should be noted that similar results have been obtained earlier by Fraser and Huang [125].
Model B. This model has been extensively used by Vereninov and coworkers [127, 128, 129, 130], and the code is now available on Vereninov’s Cell Ion Flux. It assumes exact electroneutrality and iso-osmolarity between the internal and external solutions. Instead of Ohm’s law, the passive fluxes J are computed through the Goldman equation, such as
where pNa is the membrane permeability for Na+, and u is the dimensionless membrane potential:
The membrane potential is deduced not from the difference between positive and negative charges, as in Model A, but is back-calculated from passive fluxes. The contribution of the Na+-K+ pump is represented by a linear term:
The cotransporters NC, KC, and NKCC are included as well, and their activities are expressed through the ratio of intracellular-to-extracellular concentrations of the respective ions.
We used this model to investigate the effect of various intracellular initial concentrations on the stabilized values of ψ and ion concentrations. The significance of the starting concentrations is that they implicitly define both [X-] and z, which are conserved during the subsequent evolution of the system toward a stable state:
The results are shown in Fig. 1B. The transport parameters were taken at the preset default values at Verininov’s Cell Ion Flux; the osmolarity P = 310 mM was kept constant. Eliminating cotransport changed the numerical values, but not the general shapes of the curves (not shown). Only the sum of cations affects the balanced state, but not the individual values of [Na+] and [K+].
Model C [126]. Dmitriev and coauthors [126] based their calculations on a model similar to Model A in respect with how passive cation fluxes and the membrane potential are computed. They use charge difference to calculate the membrane potential and assume passive chloride transport. One feature that distinguishes this model from others is that neutral and charged impermeant osmolytes are considered separately, with z being the average of the entire pool. Initially, cell is assumed to be a cube, which provides enough extra surface to accommodate a volume increase of up to ~40% without a change in membrane capacitance. The pump activity is not constant, as in Model A, but is a function of sodium concentration:
The other major difference is the computation algorithm, which is described in the other article by Dmitriev and Linsenmeier in this issue. The program with an explanation and tutorials is available for download from https://sites.northwestern.edu/ralcomputational/. The results for a balanced state are depicted in Fig. 1C.
Model D. A modified model of neuronal ion dynamics from Düsterwald et al. [18] is based the same principles as Model A, including the “charge difference” approach of Fraser and Huang [124] (the code is available on Model of Neuronal Chloride Homeostasis). The ATPase pump rate is assumed to have cubic dependence on sodium, similar to Model C; this formulation has been shown to better replicate kinetic models than assuming constant pump rates [15]:
The KCC2 potassium-chloride cotransporter is included in this model, with the rate of transport determined by the difference between the driving forces for potassium and chloride:
Finally, the model incorporates volume changes based on the difference between intracellular and extracellular osmolarity. An analytical solution guarantees stable steady states for physiological ranges of pump rates, z and X, and was used to generate Fig. 1D. The results reinforce the conclusion that hyperpolarization, an increase in cation concentration, and a decrease in permeant anions accompany an increase in z, in agreement with experimental observations of the effects of DNA replication (see above).
To mimic the effect of potassium channel blockers, we varied the permeability pk or the conductance gk of potassium channels in Models B and D. First, we computed the inward driving forces for sodium, ψNa = ψ – ψNa. Inhibition of potassium channels results in depolarization, a slight loss of sodium, and a decrease in the inward driving force for sodium, ψNa = ψ – ψNa. The concentrations of Piwere fixed at 5 mM inside and 1 mM outside, resulting in ψPi = 42.6 mV for the monovalent ion and ψPi = 21.3 mV for the divalent form. Thus, the driving force for inorganic phosphate, ψPi = ψ – ψPi, is always directed outward for negative membrane potentials. Fig. 2 demonstrates the effect of potassium channels on the cumulative inward driving force aψNa - bψPi for sodium-phosphate cotransporters with different stoichiometries aNa:bPi. According to both models, inhibition of potassium channels should reduce the Pi intake, which may at least partially account for the observed dependence of DNA replication on potassium channels [87]. Conversely, inhibition of sodium conductance is expected to produce hyperpolarization, a decrease in [Na+], and an augmentation of Pi transport (not shown). Although some experimental data are consistent with the latter conclusion [131], most experiments show the opposite trend [132, 133]. Obviously, the effects of monovalent ions extend beyond the enabling of phosphate intake.
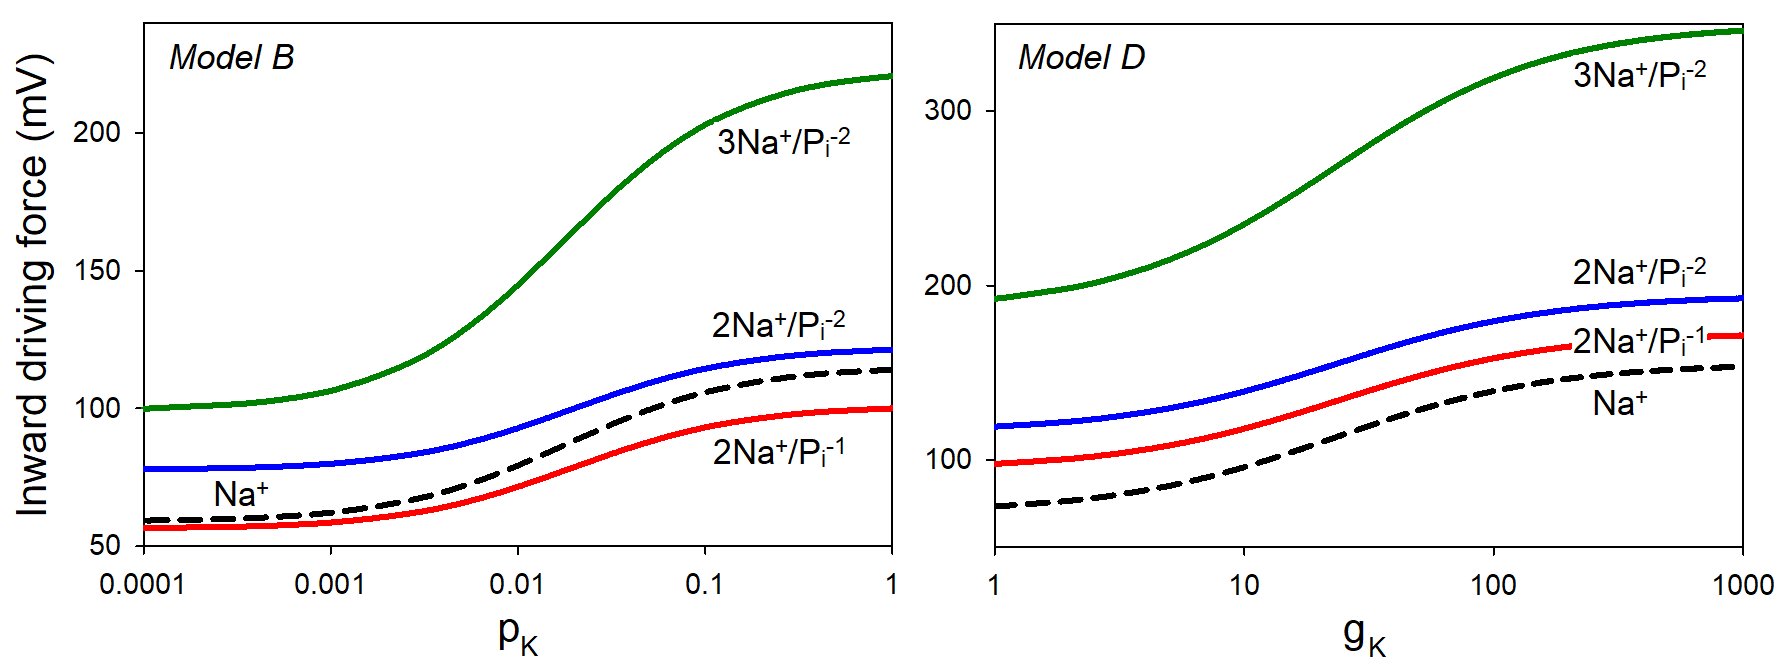
Figure 2. The effect of potassium permeability pk (min-1) or conductance gK (mS/cm2) on the driving force for the sodium-potassium cotransport for different types of transporters, according to Models B and D. The broken lines show the driving force for sodium alone. The initial parameters in Model B were chosen as follows: z = 2, [Na+]i = 45 mM, [K+]i = 150 mM, [Cl-]i = 35 mM, Pi = 5 mM, [Xz-]i = 80 mM, [Na+]e = 140 mM, [K+]e = 5.8 mM, [Cl-]e = 116 mM, [Xz-]o = 48.2 mM, and Pe = 1 mM. The permeabilities for other ions were pNa = 0.0017 min-1 and pCl = 0.011 min-1. In Model D, the analytical solution was used while varying potassium conductance with constants as per Table 1 in [0]: [Na+]e = 145 mM, [K+]e = 3.5mM, [Cl-]e = 119 mM, z = 0.85, gNa = 20 μS/cm2, gCl = 20 μS/cm2.
The vast majority of data on cell volume regulation have been obtained under acute conditions. For example, the concepts of regulatory volume increase or decrease refer to the responses that follow a sudden step in osmolarity and are often observed within the next 10-20 minutes. The effects of prolonged exposure to altered osmolarity are referred to as isovolumetric regulation [23, 135], which may be controlled by other mechanisms. Furthermore, on a longer time scale, cell volume can only be conserved as the average over cell population or in terminally differentiated cells. For a growing culture, the very notion of cell volume regulation may have to be revised: it appears that it is rather the dry mass concentration (or cell water content) that is subject to control [25, 136]. Similarly, a strict separation of intracellular osmolytes into permeant and impermeant does not apply to proliferating cells, because both the amount of organic osmolytes and their average charge are liable to change. However, the specific manner of their change would depend on their chemical nature, which has not been well characterized. If most of the negative charge derives from proteins, z would not be expected to vary significantly during cell growth. On the other hand, if the negative charge is carried by nucleic acids, z would be subject to change.
The data presented in Table 1 show that phosphorus is indeed a major contributor to the total pool of membrane-impermeant anions in most cell types. It is represented by diverse types of chemicals, including small metabolites and large polymers. The role of DNA as an impermeant anion deserves special consideration, especially in small cells, where the cell-averaged concentration of DNA-associated phosphate can reach high values (Table 2). In such cells, DNA replication significantly increases the average valency z, which is the main parameter influencing the mobile intracellular ions and membrane potential. The other interesting aspect of DNA as an anion is that, unlike chloride and other small ions, it strongly interacts with various counterions [137]. This effect is likely determined by the amount of the charge left uncompensated by cationic proteins, such as histones. Similar considerations may apply to RNA, only in the case of somatic DNA, the contribution of histones has been evaluated much more accurately, at around 50% [66], and, furthermore, the respective amounts of DNA and histones are tightly coordinated [138]. The remaining cations surrounding DNA have reduced mobility and an osmotic coefficient of 0.25 [139]. That means that a typical human lymphocyte with volume 200 μm3 [140, 141] has [Po] = 100 mM; therefore, 50 mM of cations (such as potassium) will be largely removed from osmotic interactions, exhibiting an effective osmolarity of only 12 mM. A 40 mM mismatch between the electric charge and osmolarity may or may not be noticeable; however, the difference in smaller cells can be still greater. Current mathematical models do not account for a reduced activity of ions; this, however, is one case where it may be worthwhile.
Compared to nucleic acids and other sources of phosphorus, the contribution of negatively charged proteins seems moderate in most cell types. It is also less dynamic because the composition of the proteome undergoes relatively minor changes with cell cycle.
Since various cell types experience hyperpolarization and potassium accumulation during their tetraploid phase [84, 85, 86, 87], we asked if these effects may be related to the incorporation of phosphorus into DNA and an increase in z rather than to some unknown specific interactions. Thus, we undertook a theoretical analysis based on various cell models, including the one developed by A. Vereninov and colleagues. In fact, the dependence on membrane potential and intracellular ions on z has been established earlier by Fraser and Huang [124] and Kay [123], and here we reproduced some of Kay’s results in Fig. 1a. We showed that all four models agree in that an increase in z leads to hyperpolarization despite the differences in the assumed transporters, their activities, and initial concentrations. Thus, we hypothesize that the long-known effect of membrane hyperpolarization is the natural consequence of DNA synthesis and the resulting increase in the valency of impermeant anions.
Despite success in theoretically explaining hyperpolarization, the limitations of our approach must be acknowledged. Viewing the cell as a uniform space free of membranes and organelles is certainly a simplification inherent in the mathematical models of ion transport and membrane potential. In reality, the cell interior has multiple charged membranes [142, 143] that may even electrically interact with the plasma membrane [144]. Nuclear envelope also has a small potential negative inside [145], and it is possible that DNA synthesis has a stronger effect on the transport between the nucleus and the cytosol than between the cytosol and environment. However, given very limited knowledge if intracellular potentials (possibly except those in mitochondria), it would be premature to attempt a more comprehensive description.
The accumulation of potassium and sodium is another salient result from all the models. As for the requirement of potassium for DNA synthesis [88, 89, 90], it is harder to establish from bare theory; nevertheless, we showed that the driving force for Pi intake is strongly reduced when potassium channels are inhibited. That may be a sufficient explanation to the experimental data, though it does not exclude the possibility that specific interactions may also play a role. For example, it follows from the model that inhibition of sodium conductance should promote the import of Pi (not shown), but the correlation between cancer and sodium channels [84] does not support this conclusion. But such obvious and inevitable limitations do not take away from the usefulness of cell modeling. The explanation of the Gardos effect in erythrocytes that can be found elsewhere in this edition [Lew, ibid.] is another excellent example of the power of theoretical approach in cell physiology.
The stimulus for this work has been a talk by Dr. A. Kay (University of Iowa) at an informal online seminar dedicated to Alexey Vereninov’s 90th birthday: “What is the average charge on the impermeant ions in cells and does it matter?”. Additionally, Dr. Kay has kindly provided data for Fig. 1. The authors gratefully acknowledge discussions and advice from O. S. Andersen (Cornell), M. Gerovac (University of Würzburg), R. P. Malchow (University of Illinois), A. P. Minton (NIH), A. Onufriev (Virginia Tech), J. V. Raimondo (University of Cape Town), D. J. Scanlan (University of Warwick), M. Schick (University of Washington), S. Vijayaraghavan (Kent State University,) and S. Woodson (Johns Hopkins). The work has been supported by Kent State University Research Council (MM) and by Gatsby Charitable Foundation (KD). All authors contributed to writing of the manuscript.
The authors have no conflicts of interest to declare