Review - DOI:10.33594/000000630
Accepted 23 April, 2023 - Published online 17 May, 2023
1Institute of Cytology, Russian Academy of Sciences, St-Petersburg, Russia;
2Department of Biological Sciences, Kent State University, Kent, Ohio, USA;
3St-Petersburg State Polytechnical University, St-Petersburg, Russia
This paper was prepared by Alexey A. Vereninov for an online presentation in connection with his 90th birthday. Unfortunately, his health did not allow him to take part in this online meeting, but he hoped that his presentation would still be published. To our deep regret, he passed away on July 5, 2022. All his life, A. Vereninov worked at the Institute of Cytology of the Russian Academy of Sciences where, from 1986 to 2019, he headed the Laboratory of Cell Physiology. Alexey Vereninov was interested in answering the fundamental questions regarding ionic homeostasis in animal cells. In the last years of his life, he became particularly interested in the quantitative analysis of monovalent ion fluxes through the cell membrane. The calculation algorithm was developed by Alexey together with his brother Igor A. Vereninov, professor at St. Petersburg State Polytechnical University. The results of their work in recent years are summarized in this paper.
While diagrams like the one in Fig. 1 have been used in various publications to describe ion fluxes through the cell membrane, little has been done to quantify the balance of these fluxes in cells. In particular, the role of charged intracellular osmolytes (specifically, membrane-impermeant intracellular anions) is usually underestimated due to a lack of accessible software for calculating ionic homeostasis in a cell. Despite this lack of knowledge, it is still believed that there must exist impermeant charged osmolytes to account for the asymmetric distribution of K+, Na+, and Cl- in the cell’s cytoplasm and in surrounding medium. A groundbreaking study of the relationship between intracellular osmolytes and K+, Na+, and Cl- has been done by Stanton [2].
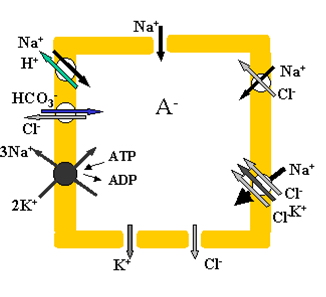
Figure 1. Primary pathways of ion transport in the animal cell [1].
In recent years, research into better understanding of the quantitative relationships governing ion fluxes between cells and their environment have taken an important place in the reseach of the Institute of Cytology of the Russian Academy of Sciences. The Institute was founded in 1957 by Dimitry Nikolaevich Nasonov, who was interested both in the uneven distribution of ions between the cytoplasm and extracellular medium and the electrical phenomena associated with these ion distributions. However, the studies of the mechanisms responsible for ionic and water homeostasis within the cell have gradually been pushed into the background due to the rapid development of other cytology research topics. These shifts brought along changes, such as the transfer from the study of frog skeletal muscles to the use of cell cultures and mathematical models. Computation of ion flux balance made it possible to analyze the mechanisms of ion transport through the cell membrane. By then, ion transport had already been known to play an important role in ion-water balance regulation and electric potential difference between the cell and medium.
Until recently, ionic and water balance computations for cells have been performed mainly for human erythrocytes, as in the pioneering work of Lew and colleagues in 1986 [3]. However, erythrocytes can hardly serve as a model of a typical animal cell. The membrane potential in erythrocytes is lower than in most other cell types, the distribution of chloride is close to equilibrium, and the rate of ion exchange is uncharacteristically low. At the Institute of Cytology, studies addressing cellular ion and water balance have been conducted using cultured and suspended human lymphoid cell lines U937, K562, and Jurkat. These cell lines proved crucial for studying cell physiology, including changes in cellular ionic homeostasis during the transition of cells from quiescence to proliferation or, conversely, to apoptosis. Results of early studies regarding alteration of ion homeostasis during the cell’s transition to proliferation were summarized in the book “Ion Transport in Cultured Cells” published by Vereninov and Marakhova in Russian [4]. The study of cellular ions in relation to apoptosis began later, when interest in apoptosis picked up in many areas of biology and medicine.
With regard to computer calculations of ion flux balance carried out at the Institute, the same mathematical model was used as the one found in the fundamental works of Jakobsson [5] and Lew and Bookchin [3][6]. It assumes electroneutrality and infinitely rapid water exchange driven by osmotic gradients. The complete basic model considers seven types of monovalent ion transport through the cell membrane that differ in the nature of forces that drive ions across the membrane. Intracellular monovalent ion content is the major factor in maintaining the whole electrical and water balance in animal cells. Concentration of free Ca2+ and Mg2+ in cytoplasm is low; their impact into the electrical and osmotic balance as well as into the transmembrane flux balance is small and these ions are not accounted in calculations. Only a single rate coefficient was used for the characterization of each ion pathway: these are apparent coefficients, which ignore molecular mechanisms of ion transfer. Therefore, the quantitative description of ion flux balance underlying whole-cell homeostasis becomes independent of any hypotheses regarding these mechanisms.
All the data shown in this section relate to unperturbed U937 cells at a stable state (which we refer to as “normal” cells). The main symbols and definitions used are shown in Table 1.
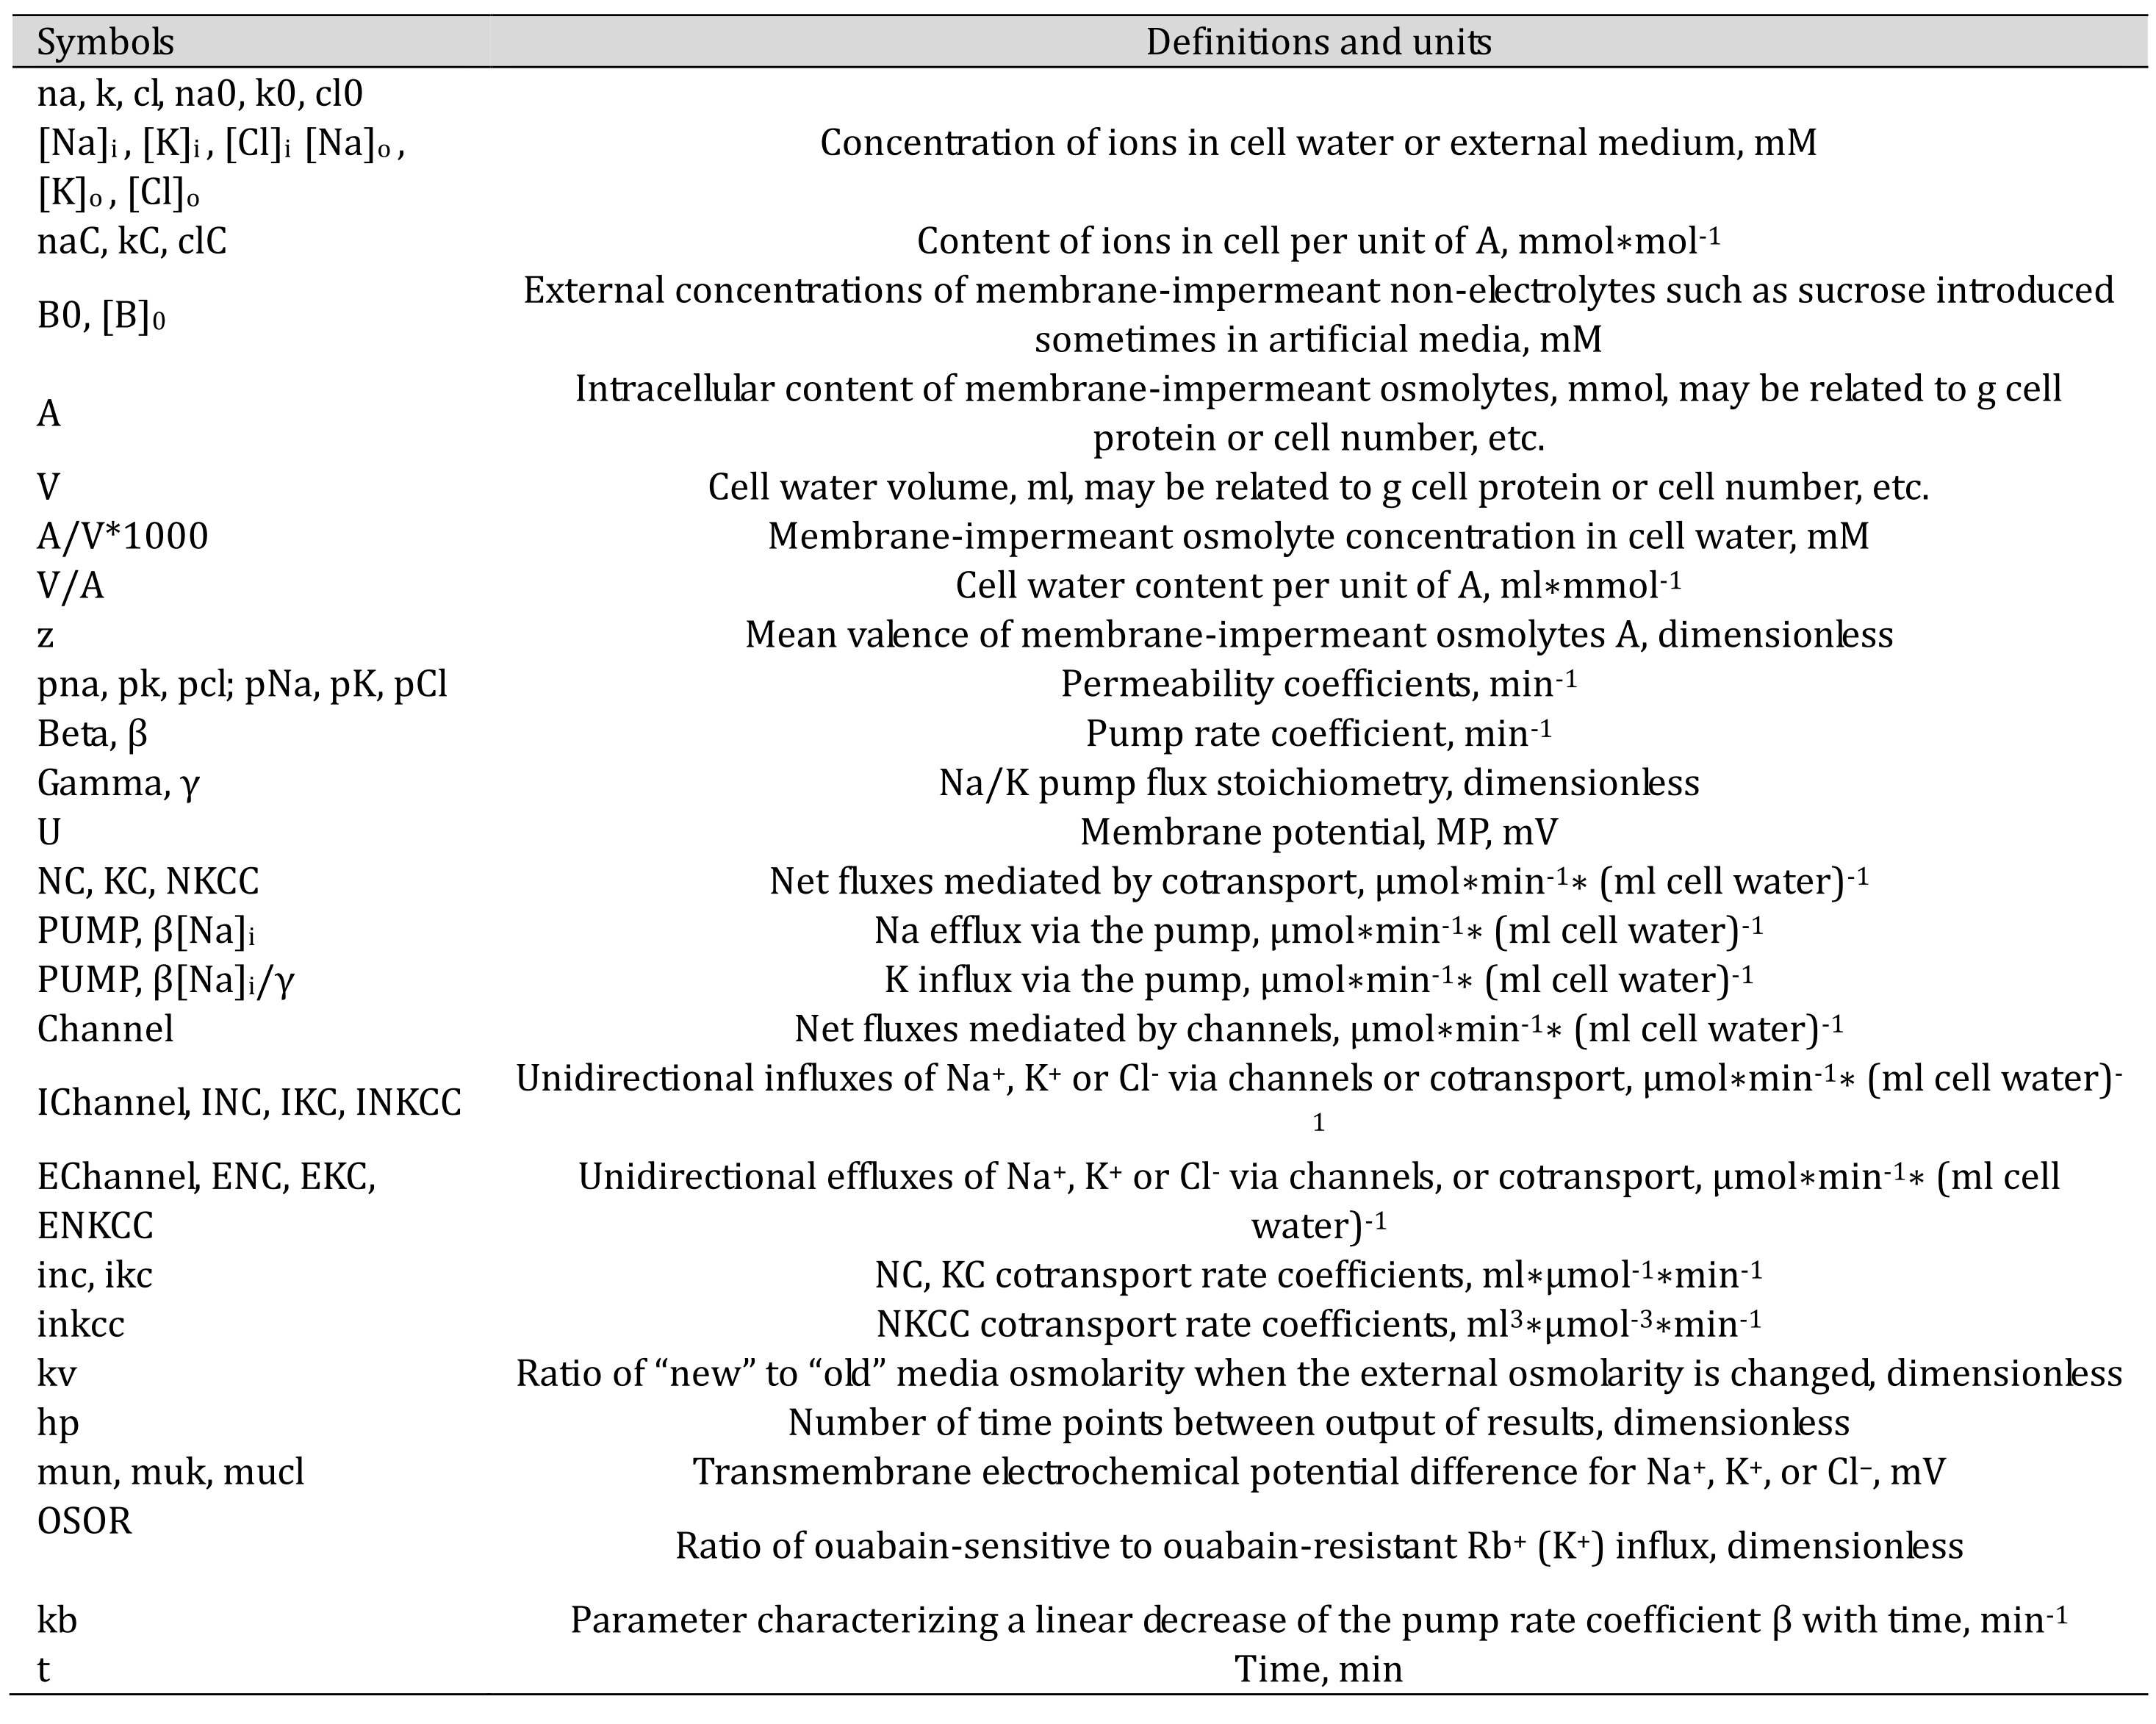
Table 1. Main symbols and definitions
In Table 2, the top row refers to external K+, Na+, and Cl- concentrations; B0 is the cumulative concentration of the external osmolytes impermeant through the cell membrane. Internal concentrations of permeant monovalent ions (na, k, cl) and the pump rate coefficient (beta) must be known. The bottom rows consist of the rate coefficients characterizing ion pathways that are defined in [7, 8]. These are computed assuming influx and efflux balance for each species of permeant monovalent ions via species-specific pathways in the cell. The default values of all parameters correspond to the data obtained experimentally at 37°C.
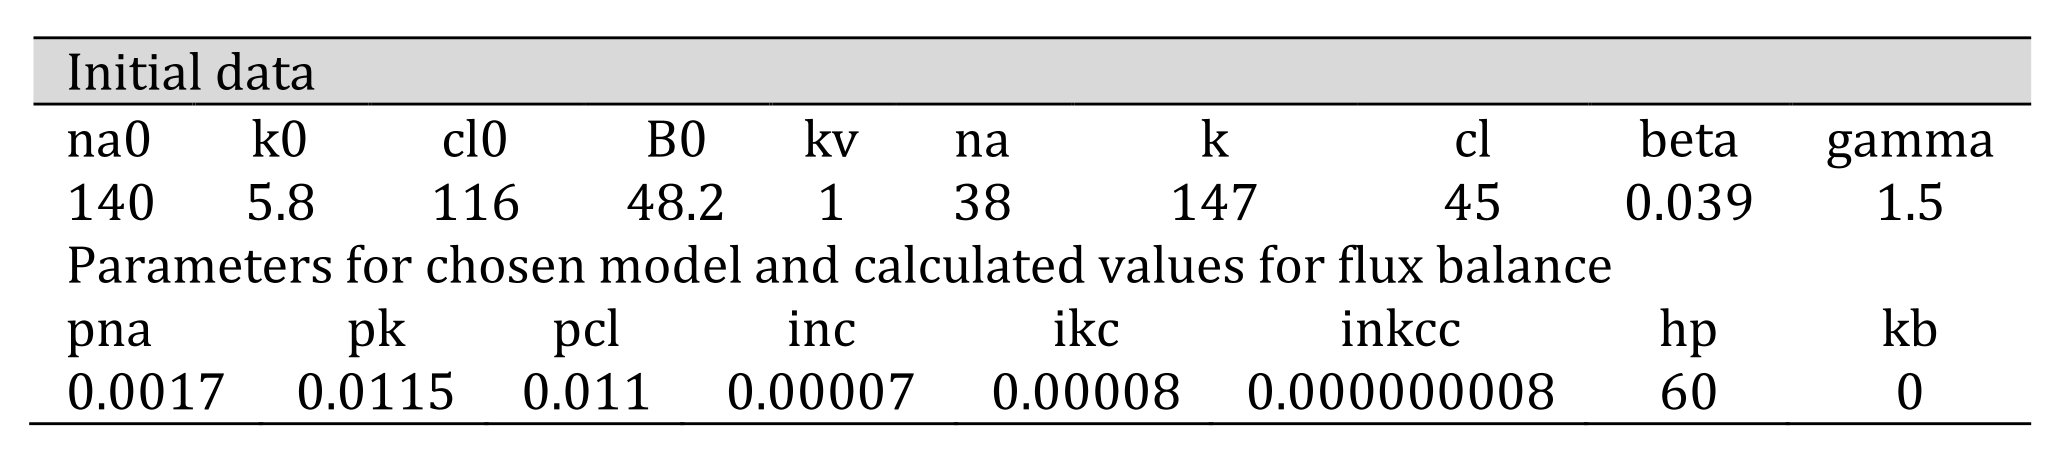
Table 2. Input data required to calculate the flux balance. Numerical data refers to U937 cells used in one of the example experiments
Table 3 lists the main variables for every time point (t, min) of a transient process. The names of the variables used for calculations come from the initial study of Igor Vereninov and Alexey Vereninov (in Russian) [7] and have been reproduced in later publications in English [8-13]. Shown are the intracellular ion concentrations (na, k, cl) at time t, membrane potential (U), electrochemical potential differences for K+, Na+, Cl- (mun, muk, mucl), cell water (V/A), and ion content (naC, kC, clC) per unit of impermeant intracellular osmolytes A (which is calculated from the input values of the initial values of K+, Na+, and Cl-)
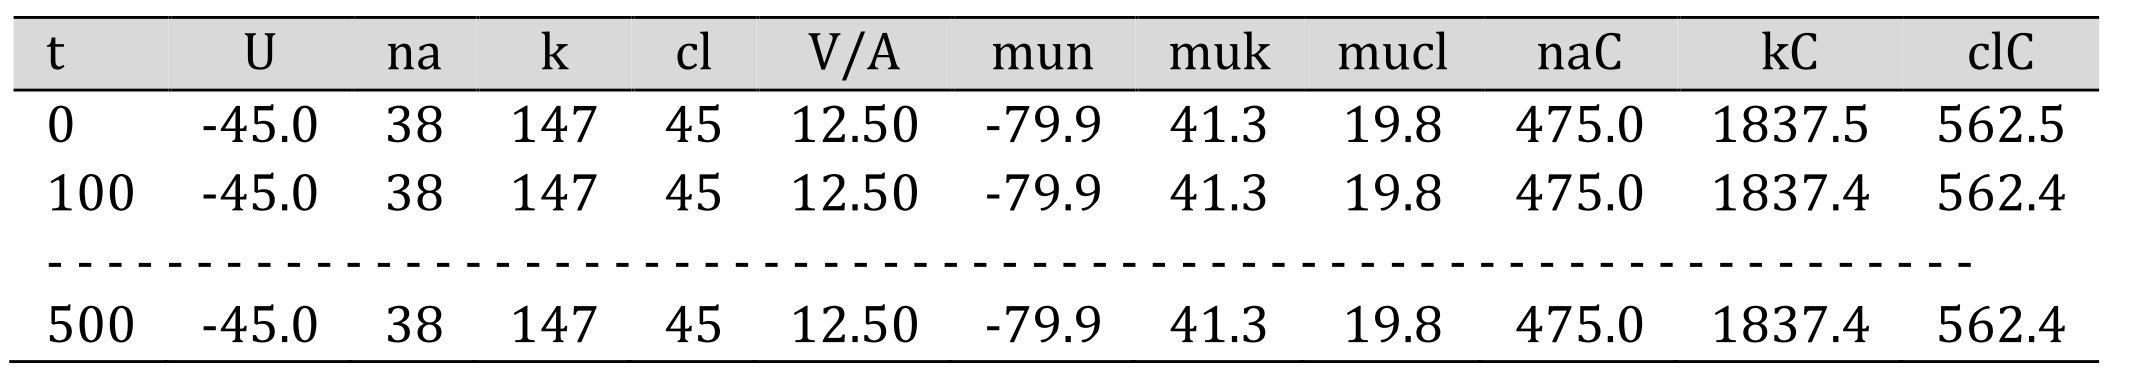
Table 3. Output data
The output data also contains unidirectional and net K+, Na+, and Cl- fluxes through every relevant pathway (Table 4) for the final time points in an old program and every recorded time point in the new program. Fluxes are given in absolute units, i.e., in μmol∙min−1∙(ml cell water)−1. These values can be recalculated in μmol∙min−1 per cell dry mass if cell water content per dry mass is known from a buoyant density assay or from other methods. Presented at the bottom of Table 4 is the OSOR indicator (i.e., the ratio of ouabain-sensitive to ouabain-resistant influx of K+ (Rb+)). It is the OSOR value that makes it possible to find a single set of parameters corresponding to a single solution of the flux balance equations. Comparison of the calculated share of K+ (Rb+) influx inhibited by bumetanide with the real share, which is easily to measure, makes it possible to verify the correctness of the chosen parameters.
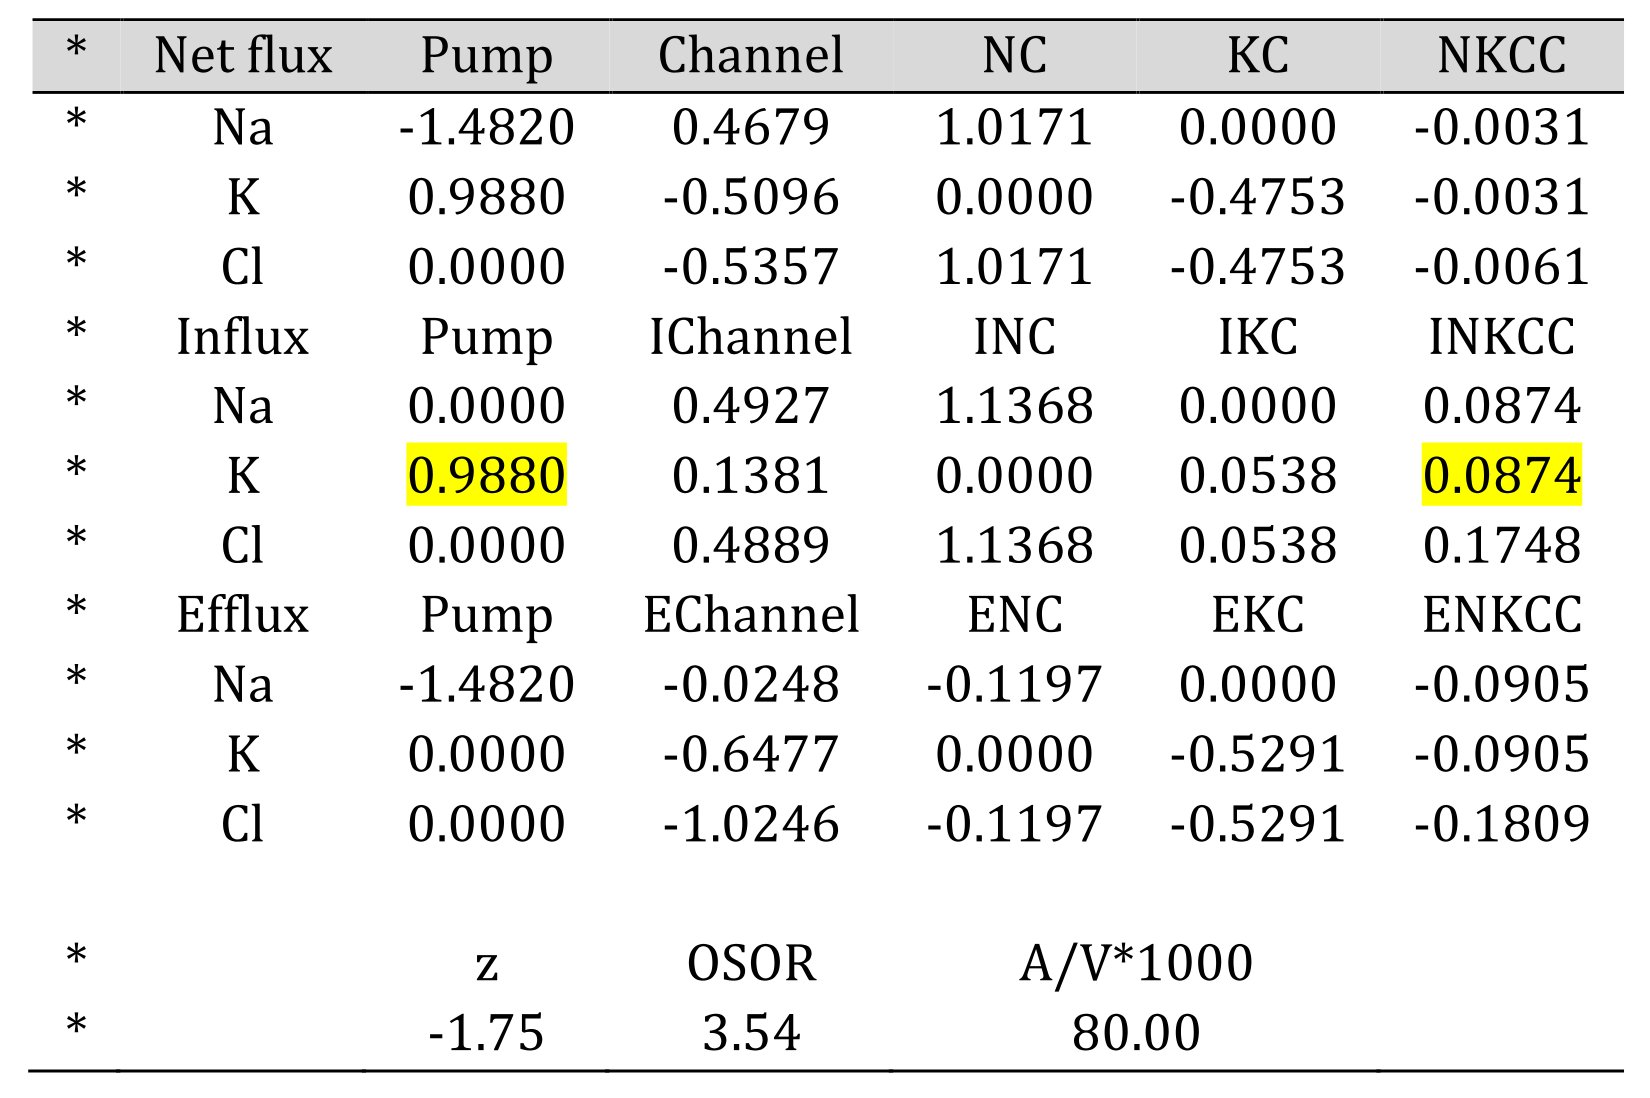
Table 4. Unidirectional and net K+, Na+, and Cl- fluxes. Bumetanide-inhibitable K+ (Rb+) influx is 10% to pump flux, marked in yellow.
All data shown relate to normal U937 cells in the balanced state (i.e., when the efflux and influx of K+, Na+, and Cl- across the cell membrane are equal). Now we turn to transient processes in U937 cells.
Calculations predict ion changes after pump shutdown via ouabain in normal U937 cellsImportantly, the parameters used in the modeling of this transient process are the same as for normal cells under a balanced state; no fitting is required to improve the match with experimental data (Fig. 2). Neither an inclusion of all cotransporters in the model is necessary [12]. The agreement between the predicted and observed changes in ionic and water balance caused by sodium pump shutdown is the most convincing evidence of the validity of the approach and the model used. The main limiting factor in solving physiology-related issues is the accuracy of experimental data and not the details of the model itself.
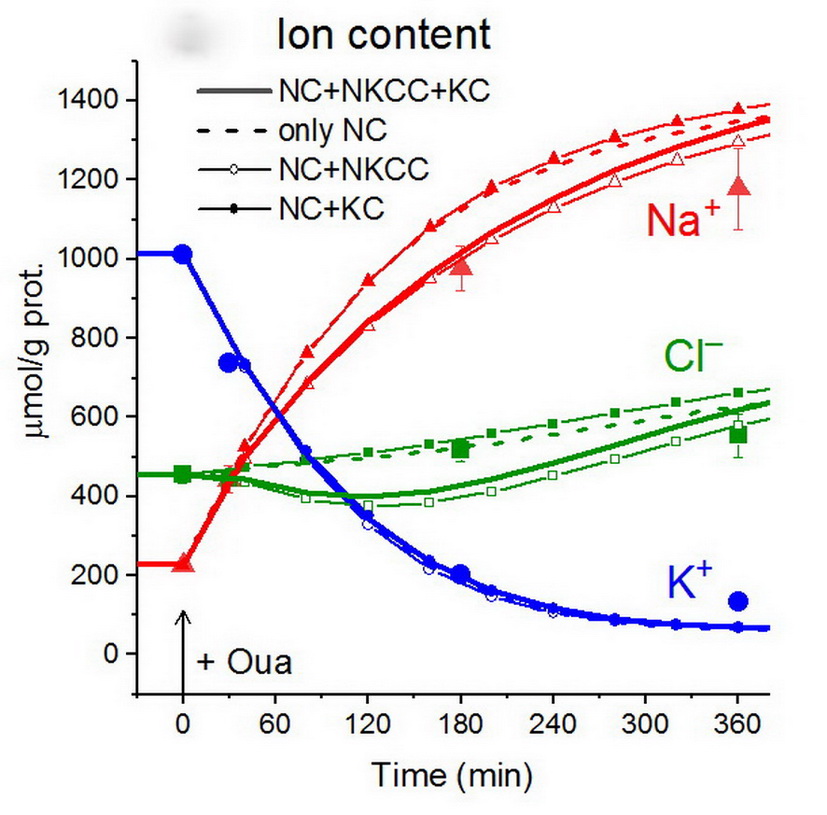
Figure 2. Disturbance of cell ionic homeostasis after inhibiting the sodium pump. Experimental data for U937 cells are shown with large symbols (± SE, n = 4) and the computed values for various sets of transporters with lines and small symbols. Ouabain was applied at t = 0, which was modeled by changing beta from 0.039 to 0.
The effect of Cl- channel permeability on the rates of transitions in ion and water homeostasisCalculations were done with parameters corresponding to the ionic balance in normal U937 cells. Notably, intracellular K+ and Na+concentrations become close to their steady state values, while intracellular Cl- concentrations and water content undergo major changes (Fig. 3).
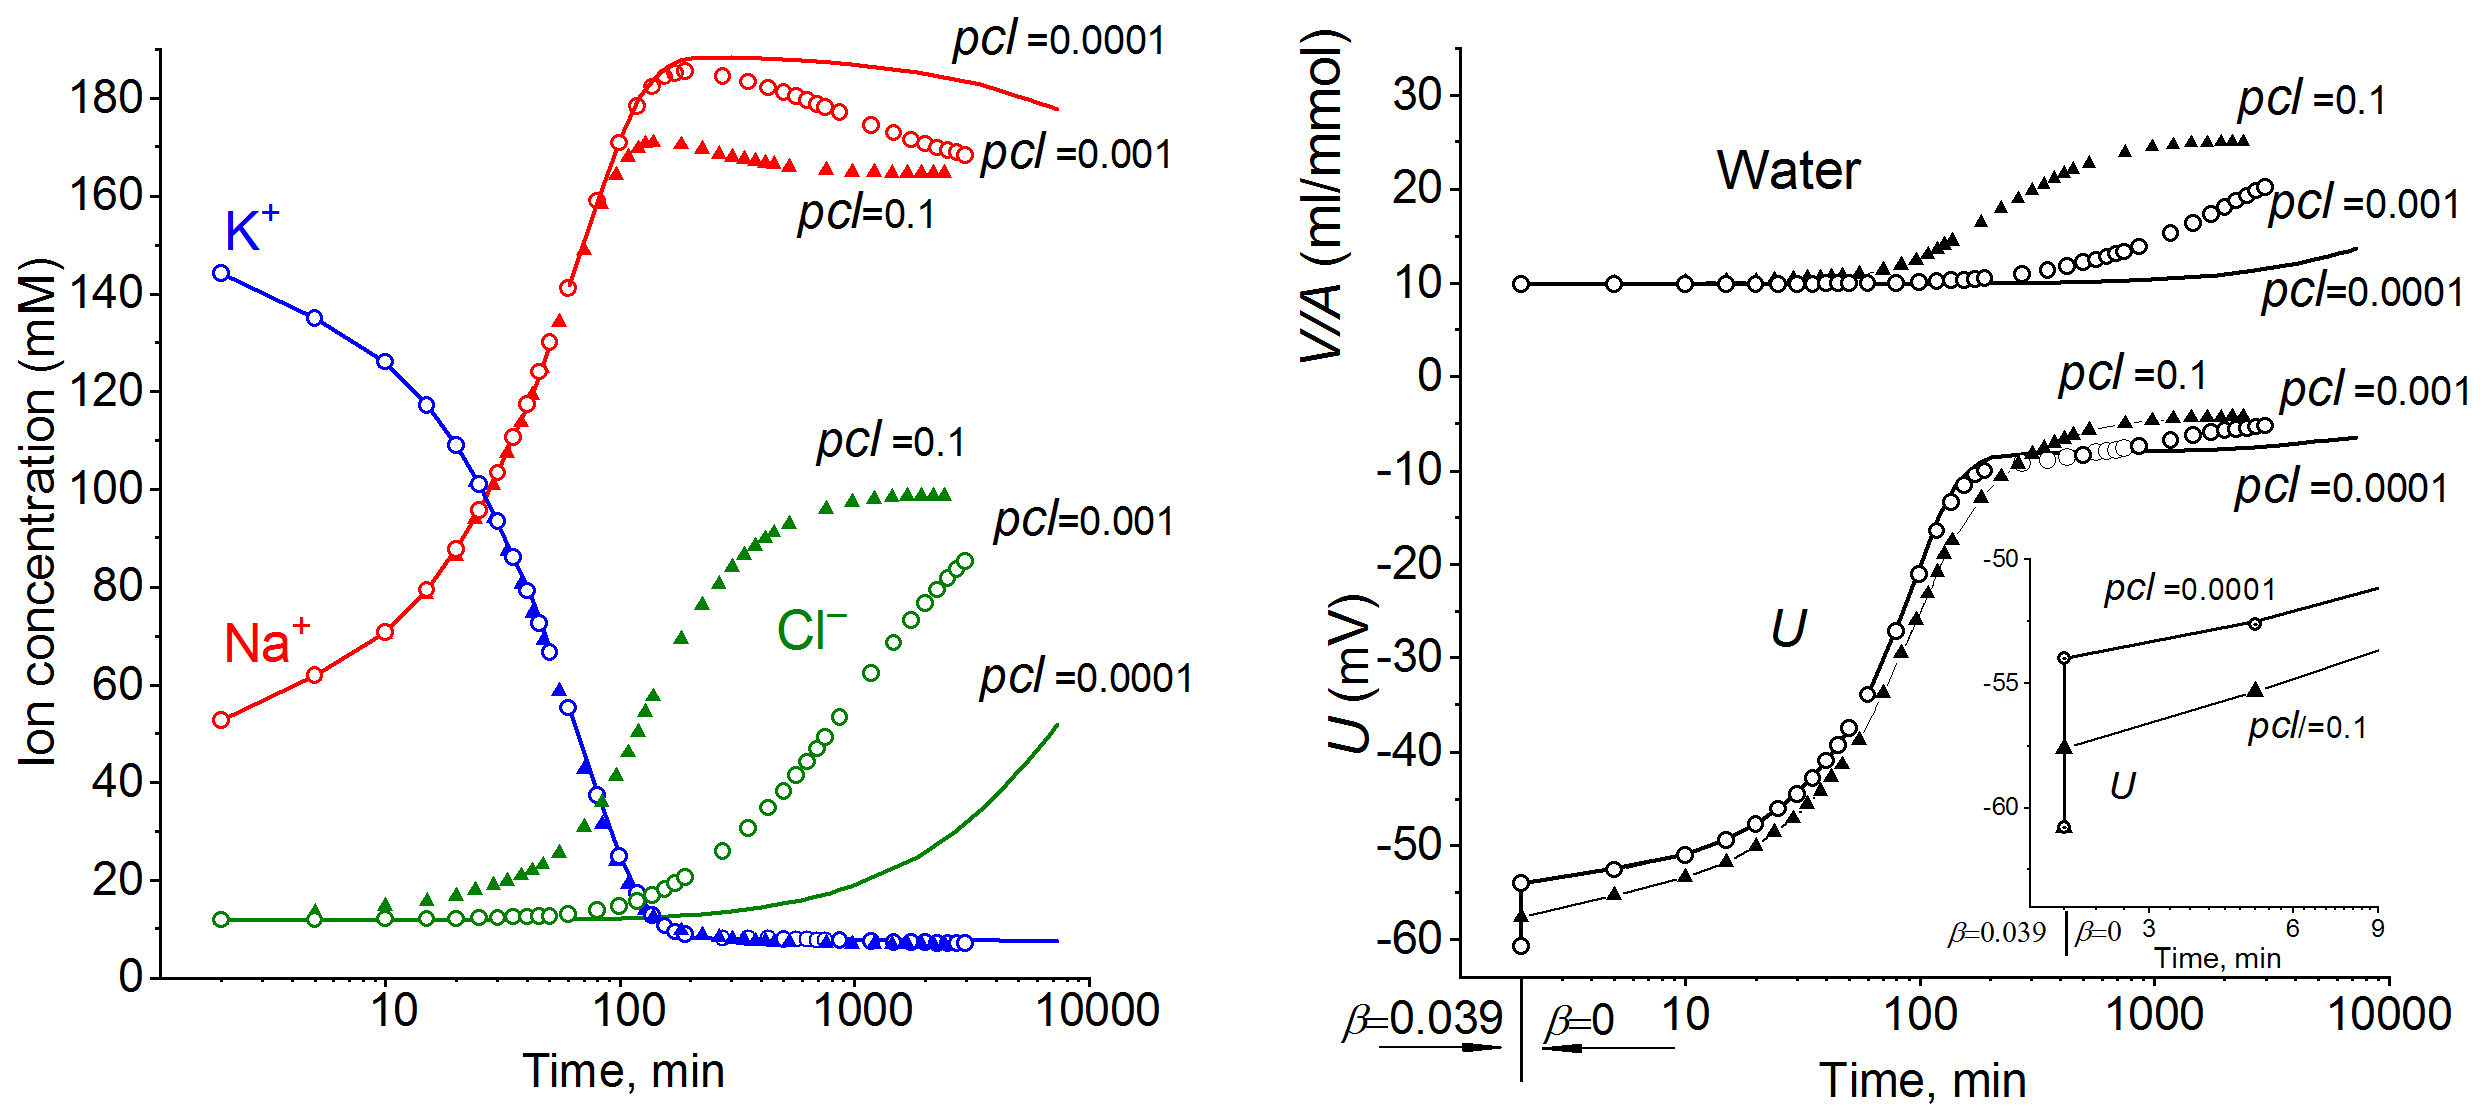
Figure 3. Effect of Cl- channel permeability on the rate of transitions in ion and water homeostasis after inhibiting the Na+/K+ pump. Data was calculated by using the software BEZ01B with parameters corresponding to the ionic balance in normal U937 cells [10].
Effect of external impermeant osmolytes on the rate of change of ionic homeostasis caused by sodium pump inhibition [12]Calculations clearly show that even at low concentrations, extracellular impermeant osmolytes (which are always present in real experiments) significantly decrease the swelling caused by the pump inhibition (Fig. 4).
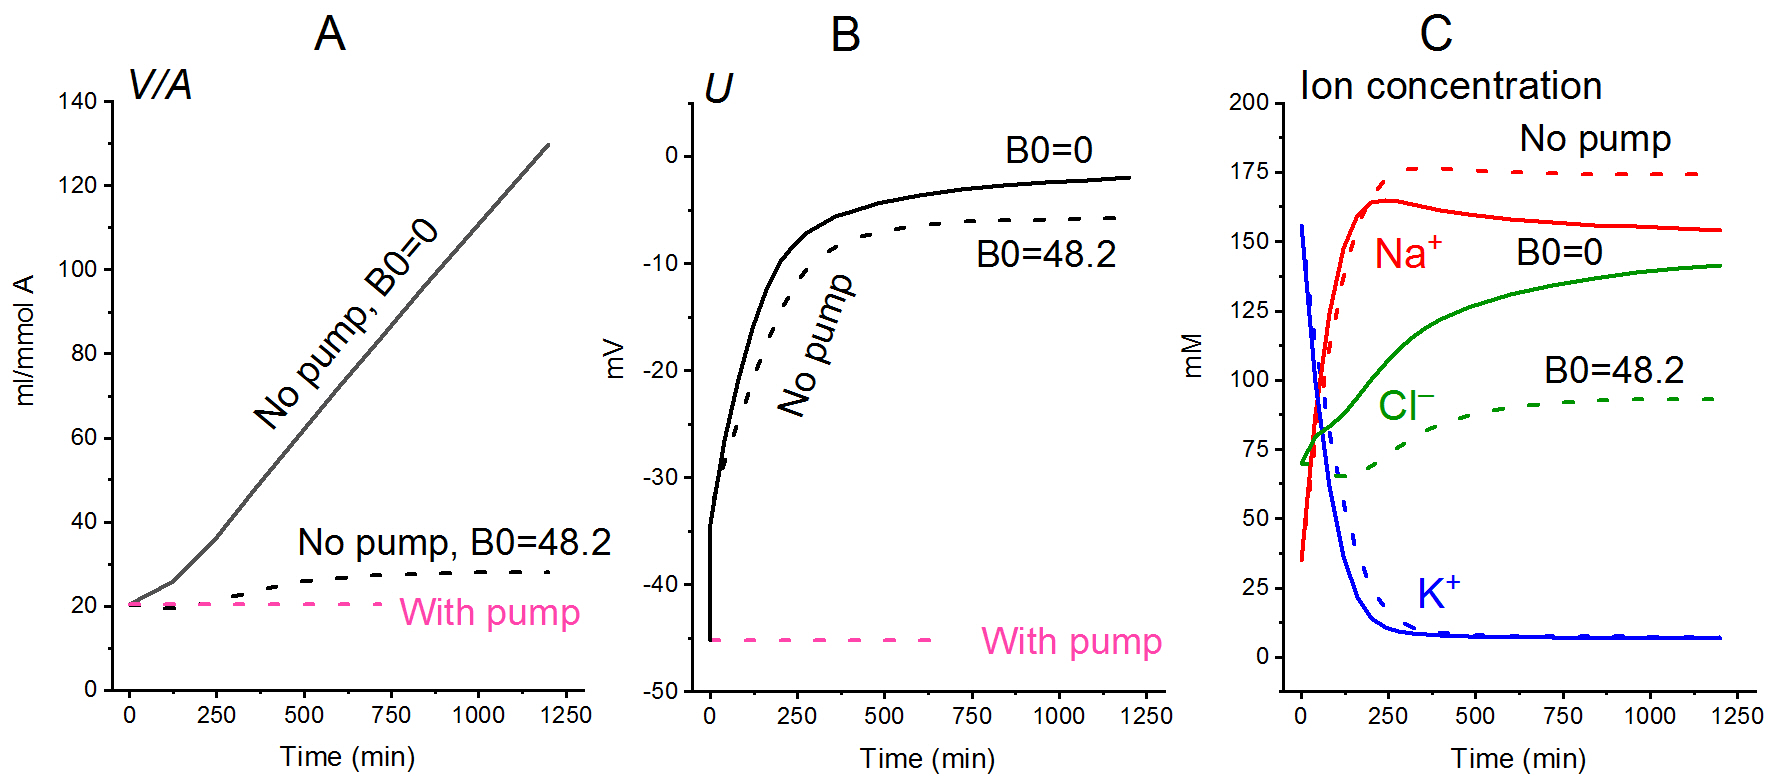
Figure 4. Effect of impermeant external osmolytes B on the cell swelling caused by blocking the pump. The calculations were performed for the U937 cell model with a full set of cotransporters (NC+KC+NKCC) and parameters as in normal U937 cells. The assumed values of the parameters were as follows: [B]o = 0, [Na]o = 149.2, [K]o = 5.8, [Cl]o = 155 mM (solid lines) or [B]o = 48.2 mM, [Na]o = 140, [K]o = 5.8; [Cl]o = 116 (dashed lines). To mimic pump inhibition, beta was reduced from 0.039 to 0 at t = 0. All other parameters remain unchanged [12].
Na+/K+-ATPase Pump stops when external Na+ is changed to Li+ [9]Experimental studies of ion and water balance in U937 cells caused by the cessation of the sodium pump activity were carried out not only with inhibition by ouabain, but also with a little-known method of transferring cells to a medium in which sodium was substituted by lithium. The dynamics of Li+ entry and K+ exit following the transfer is similar to that in ouabain treatment (Fig. 5A, B). As soon as intracellular Na+ is lost and replaced by Li+, the Na+/K+-ATPase pump stops. This could be determined from the abrupt decrease in the ouabain-sensitive Rb+ influx (Fig. 5C). Some delay in this effect is seen in the Li+ medium since it takes time to reduce the intracellular Na+ concentration. However, unlike the treatment with ouabain, inhibition of the pump in a Li+ medium is recoverable (Fig. 5F).
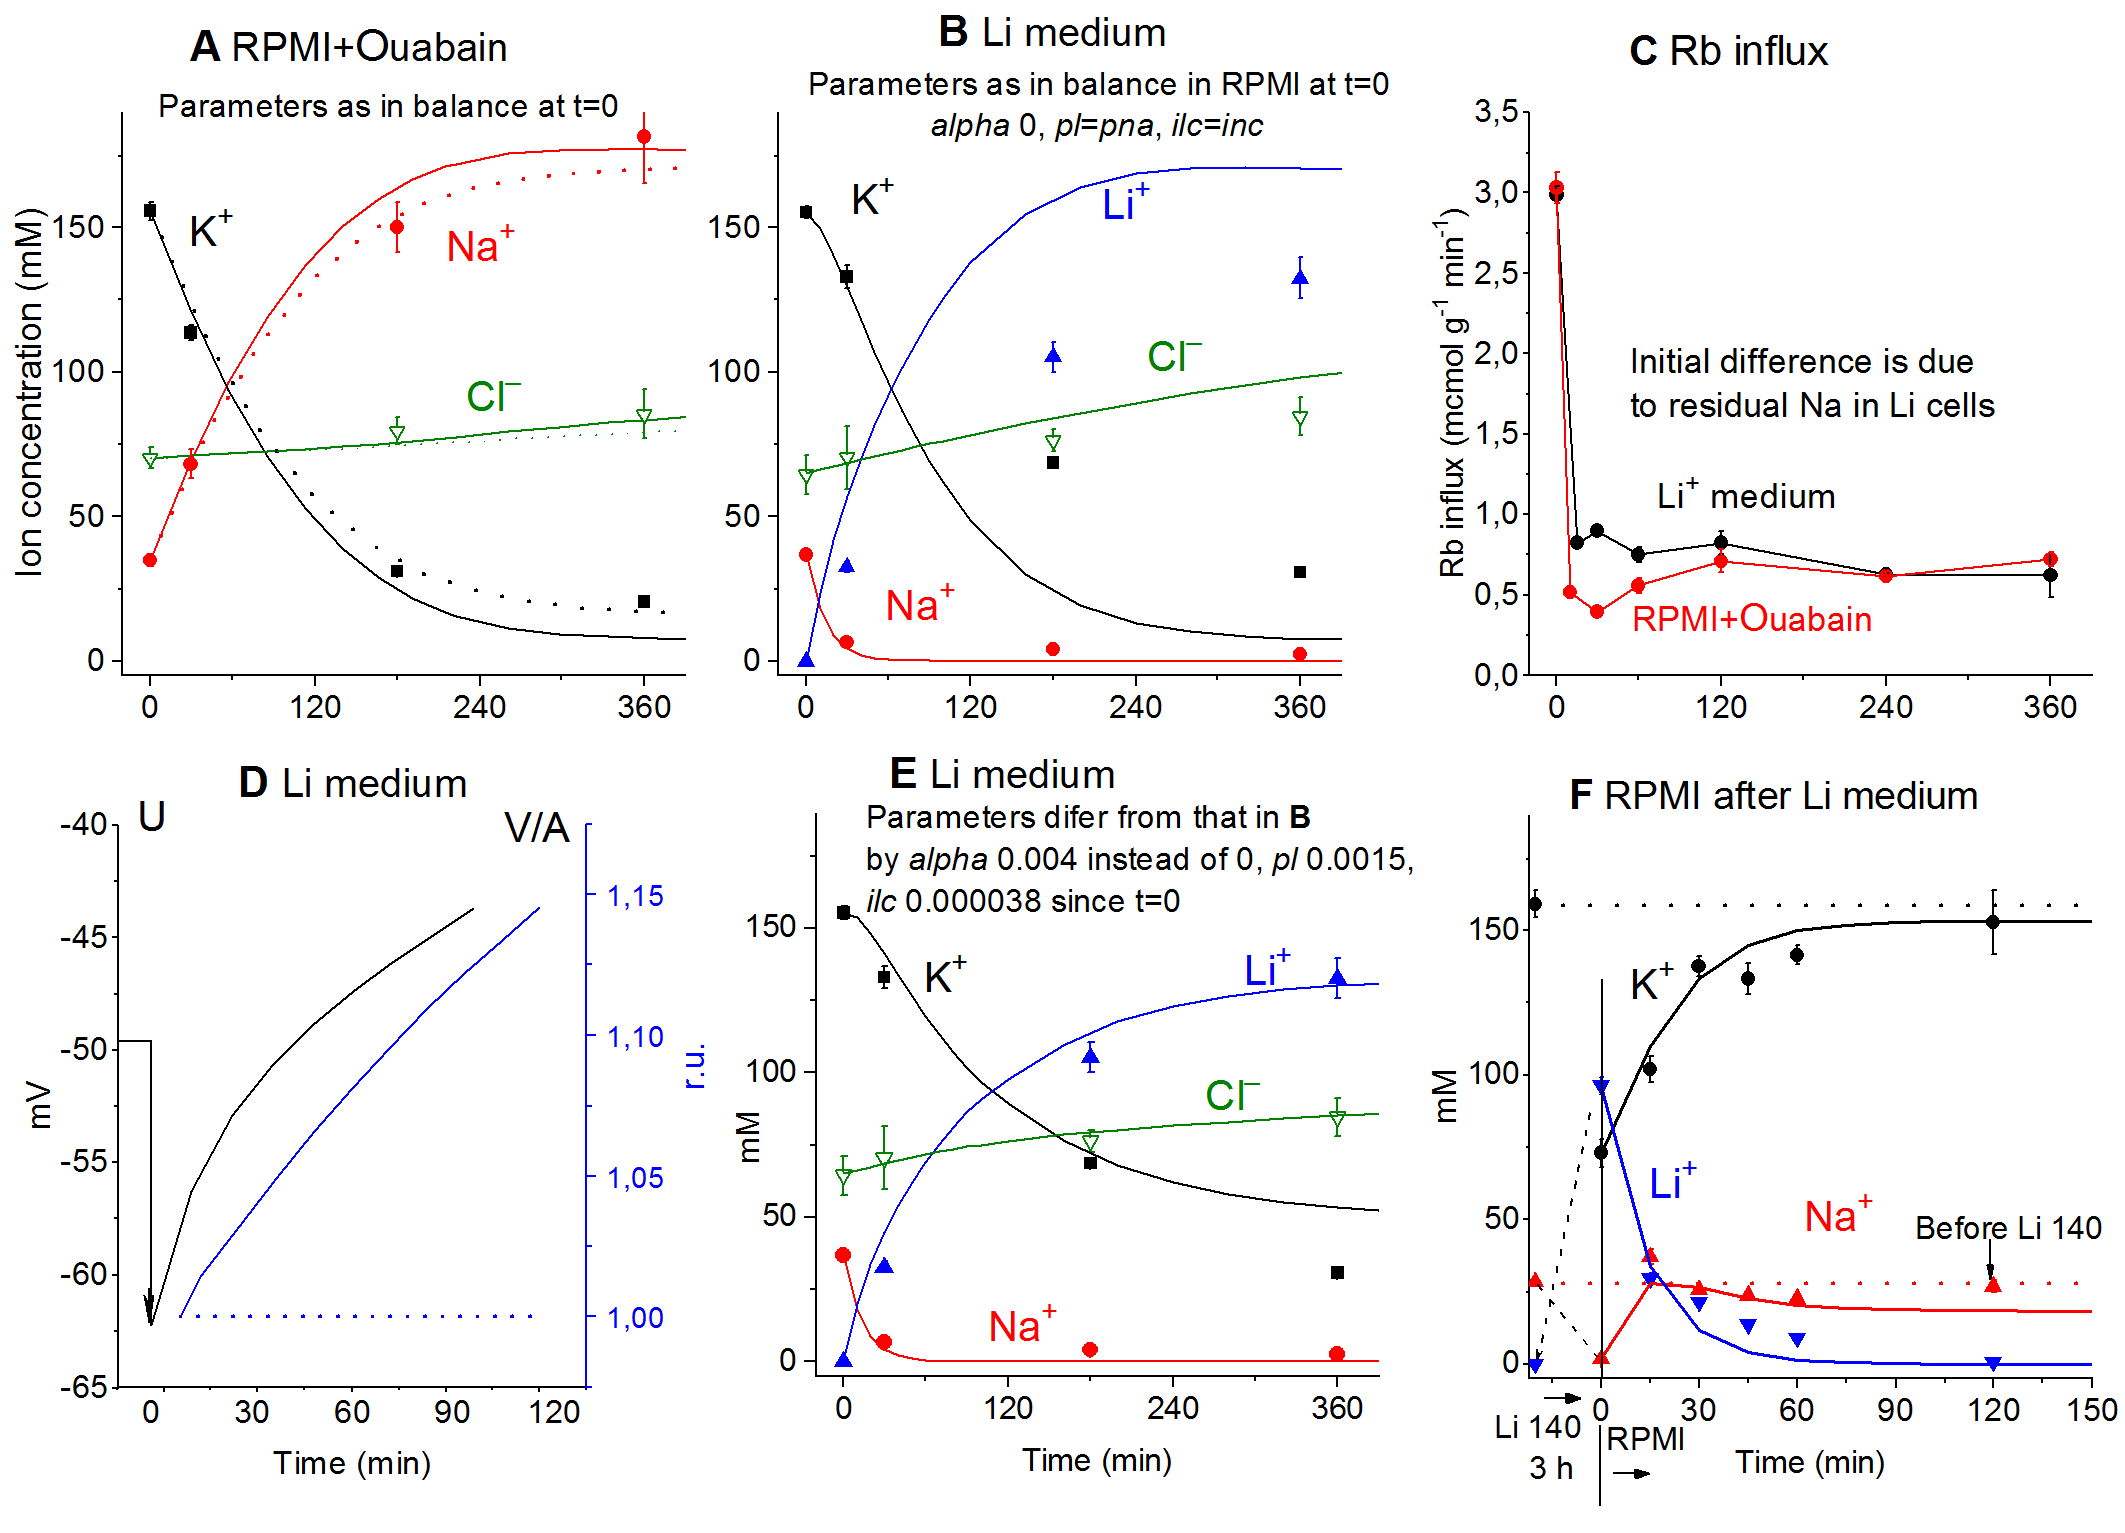
Figure 5. Ion changes caused by pump inhibition with ouabain or by replacement of external Na+ for Li+. Symbols: experimental data obtained in U937 cells (means ± SE, n = 4), solid lines: calculated data (except for C). (A) Ouabain was added at t = 0. Calculations were run for the same parameters as in the balanced state at t = 0: na0 = 140, k0 = 5.8, cl0 = 116, B0 = 48.2, kv = 1, na = 35, k = 156, cl = 70, beta = 0, gamma = 1.5, pna = 0.00301, pk = 0.023, pcl = 0.00405, inc = 3.4E-5, ikc = inkcc = 0, hp = 400. Before blocking the pump, beta was 0.039. Dotted lines were obtained for the same parameters, except beta was changed from 0 to 0.001. (B) The parameters employed in the calculation were the same as at the balanced state in a Na medium, i.e., na0 =0.01, k0 = 5.5, cl0 = 147, l = 140, B0 = 17.5, kv = 1, na = 37, k = 155, l = 0.0001, cl = 65, alpha = 0, beta = 0.039, gamma = 1.5, pna = pl = 0.00353, pk = 0.023, pcl = 0.00413, inc = ilc=3E-5, ikc = inkcc = ilkcc = 0, kp = 0.0002, hp = 400. (C) Rb+ influx in cells placed at t = 0 into a Li+ medium or into RPMI with 0.1 mM ouabain. Rb+ influx was measured over 10 min at each given time point. (D) Membrane potential U and volume V/A of cells placed in the Li+ medium. Calculation parameters: na0 = 0.1, k0 = 5.5, cl0 =1 47, l = 140, B0 = 17.5, kv = 1, na = 37, k = 155, l = 0, cl = 65, alpha = 0.004, beta = 0.039, gamma = 1.5, pna = 0.00353, pk = 0.023, pl = 0.0015, pcl = 0.00413, inc = 3.4E-5, ilc = 3.8E-5, ikc = inkcc = ilkcc= 0, kp = 0.0002, kn = 0.0008, hp = 120. (E) Parameters as in B with small correction, i.e., alpha = 0.004, pl = 0.0015 and ilc = 3.8E-5. (F) Transient processes following replacement of external Li+ back to Na+. The cells were preincubated in the Li+ medium for 3 h, then returned to RPMI at t = 0. Calculation parameters: na0 = 140, k0 = 5.8, cl0 = 116, l = 0.001, B0 = 48.2, kv = 1, na = 2, k = 73, l = 96, cl = 76, alpha = 0.04, beta = 0.08, gamma = 1.5, pna = pl = 0.00353, pk= 0.023, pcl= 0.00413, inc = ilc=3E-5, ikc = inkcc = ilkcc = 0, kp= 0.0002, hp = 150.
To better understand changes in the ion-water balance in U937 cells during apoptosis, a solution of the inverse mathematical problem is required: namely, to find the changes in membrane parameters that would account for the observed characteristics of ion-water balance. Our results in this direction were published in 2019 [10]. A computational approach based on the data obtained in U937 cells allowed us to conclude that the redistribution of K+, Na+, and Cl- underlying apoptotic volume decrease (AVD) in U937 cells is caused by (1) progressive decrease in the Na+/K+ pump rate coefficient from an initial 0.029 to 0.013 at 4 h, (2) a significant increase in pCl (0.013–0.068) and pK (0.012–0.03, later 0.02), and (3) a moderate decrease in pNa (0.004–0.003) (Fig. 6, 7). The most critical factors are the suppression of the pump, an increase in pK and a decrease in pNa, whereas the early decrease in Cl- and water content (corresponding to AVD) are associated primarily with an increase in pCl by ~5 times and an increase in pK by ~2.6 times.
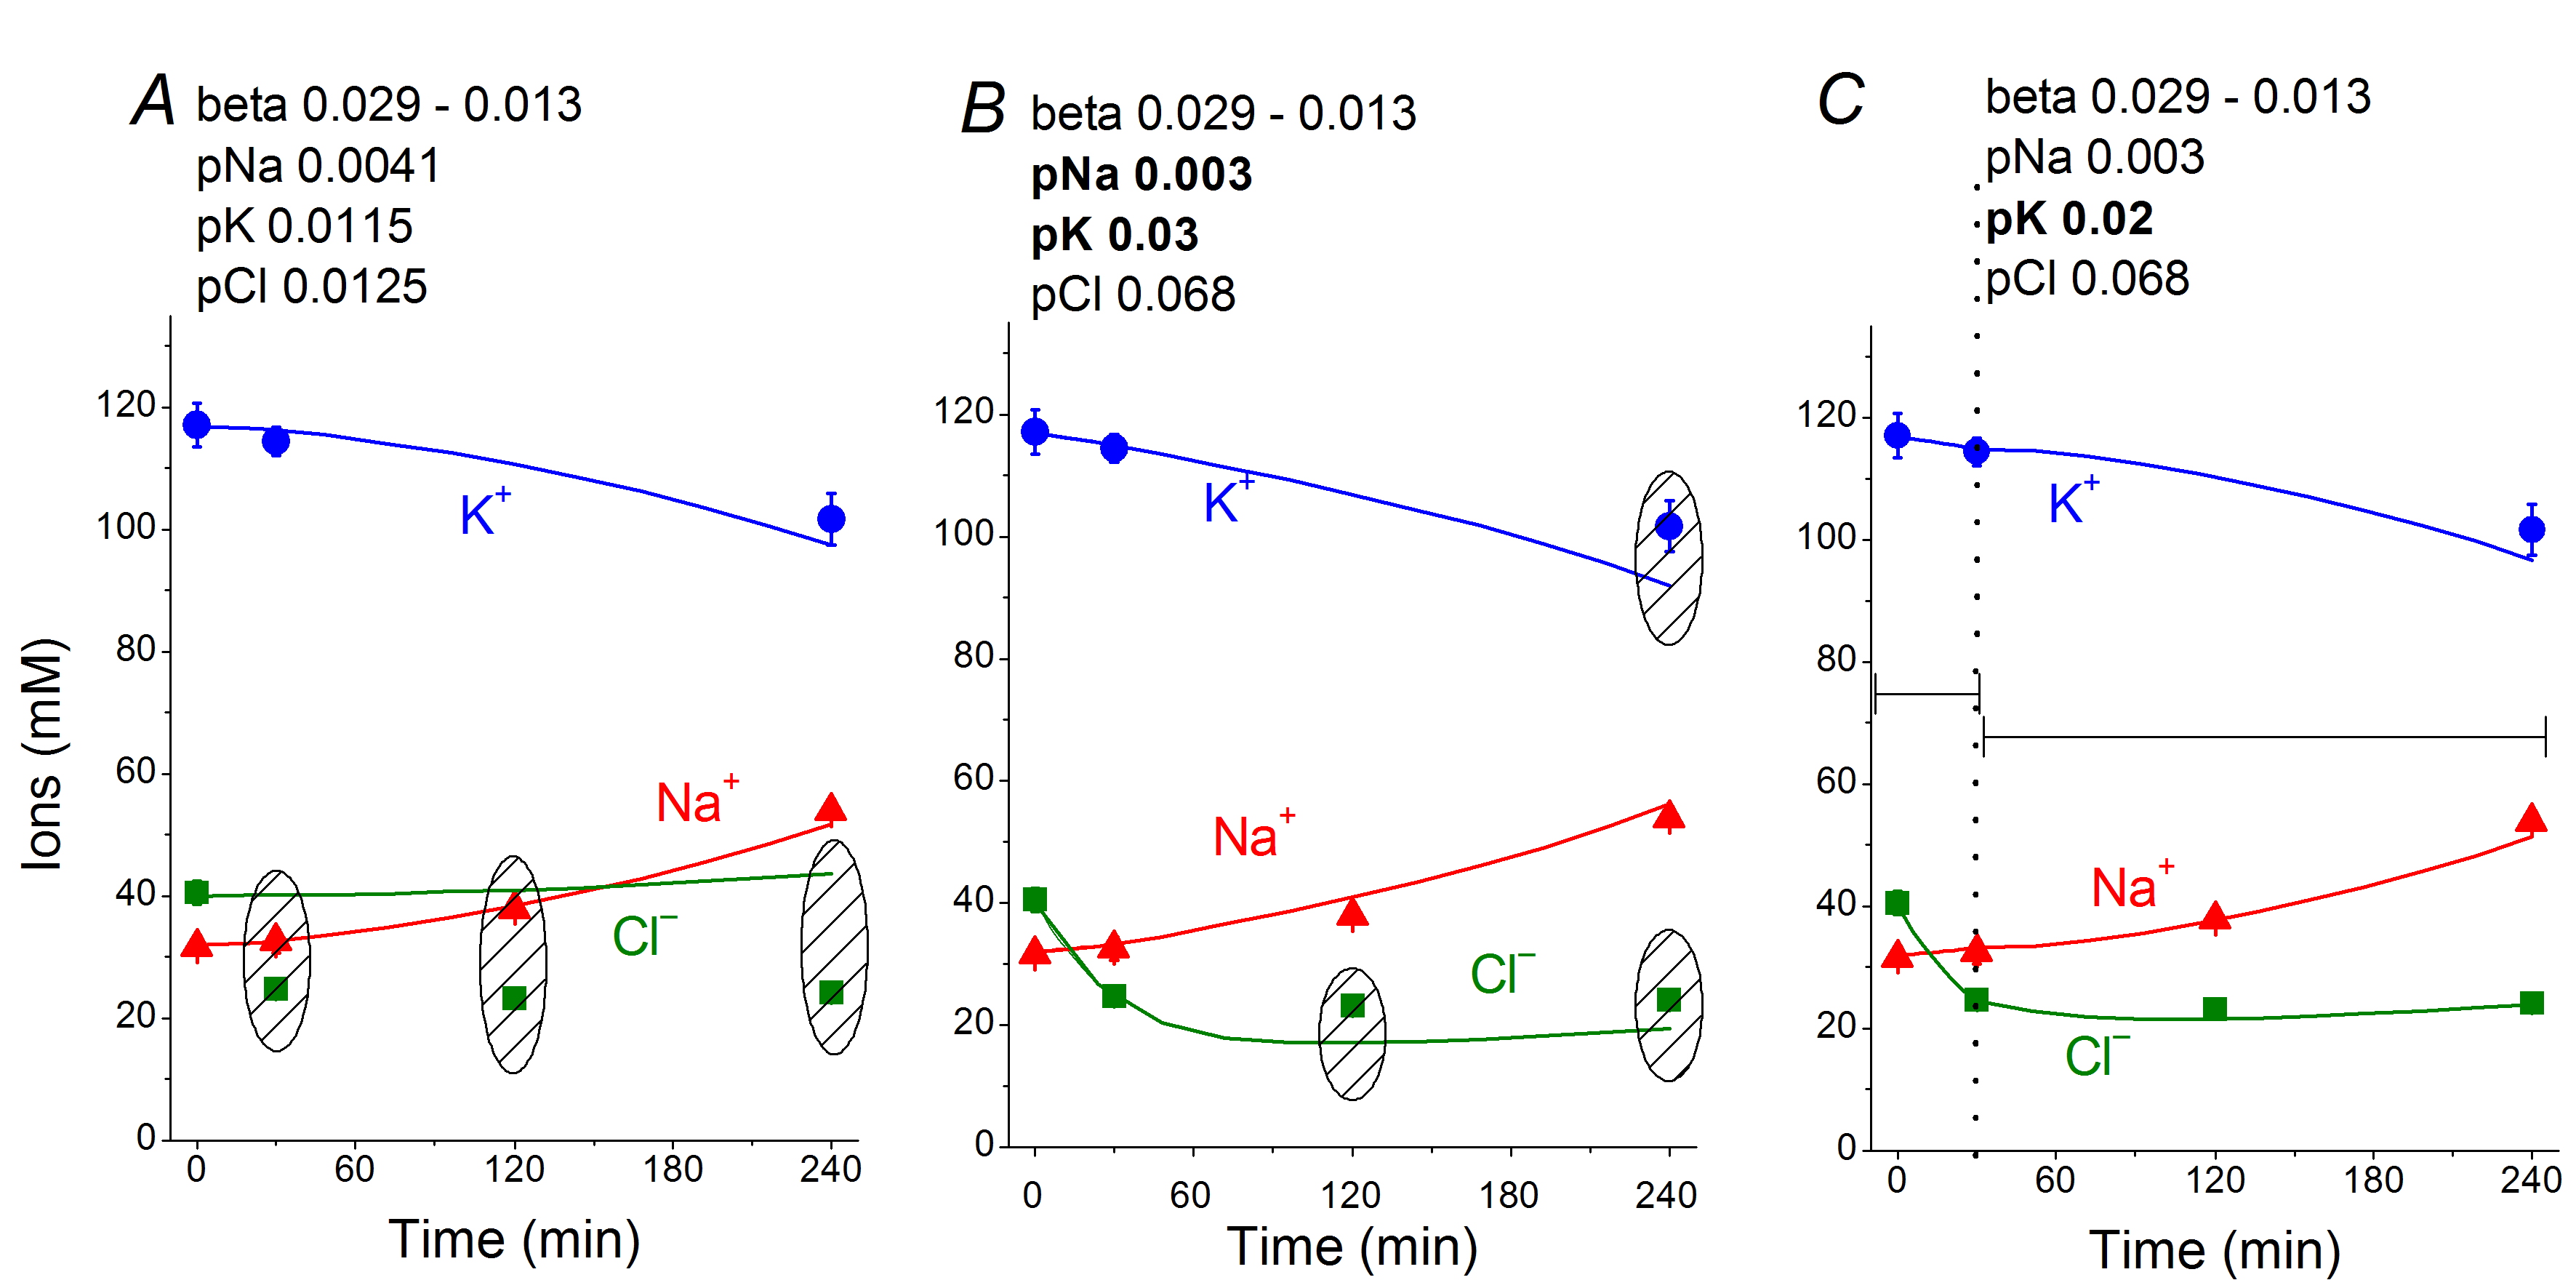
Figure 6. Time course of [K+], [Na+], and [Cl-] in normal U937 cells treated with 1μM staurosporine (symbols) and calculated (lines) for different data sets. Symbols are experimental means ± SEM from three independent experiments with duplicate determinations. Small SEM values are masked by symbols. Lines show calculated data obtained for the parameters indicated on the graphs. The initial parameters were na0 = 140, k0 = 5.8, cl0 = 116, B0 = 48.2, kv= 1, na = 32, k = 117, cl = 40, beta = 0.029, gamma = 1.5, pna = 0.0041, pk = 0.0115, pcl = 0.0125, inc = 0.000003, ikc = inkcc = 0, and kb = 0.000068. The changed parameters are shown in the layers head. (A) Linear decrease in beta only. (B) Decrease in beta and changes in pna, pk, and pcl. (C) Additional decrease in pk. Shaded regions show significant disagreement of experimental and predicted values. The calculated data was obtained by using code BEZ01B [10].
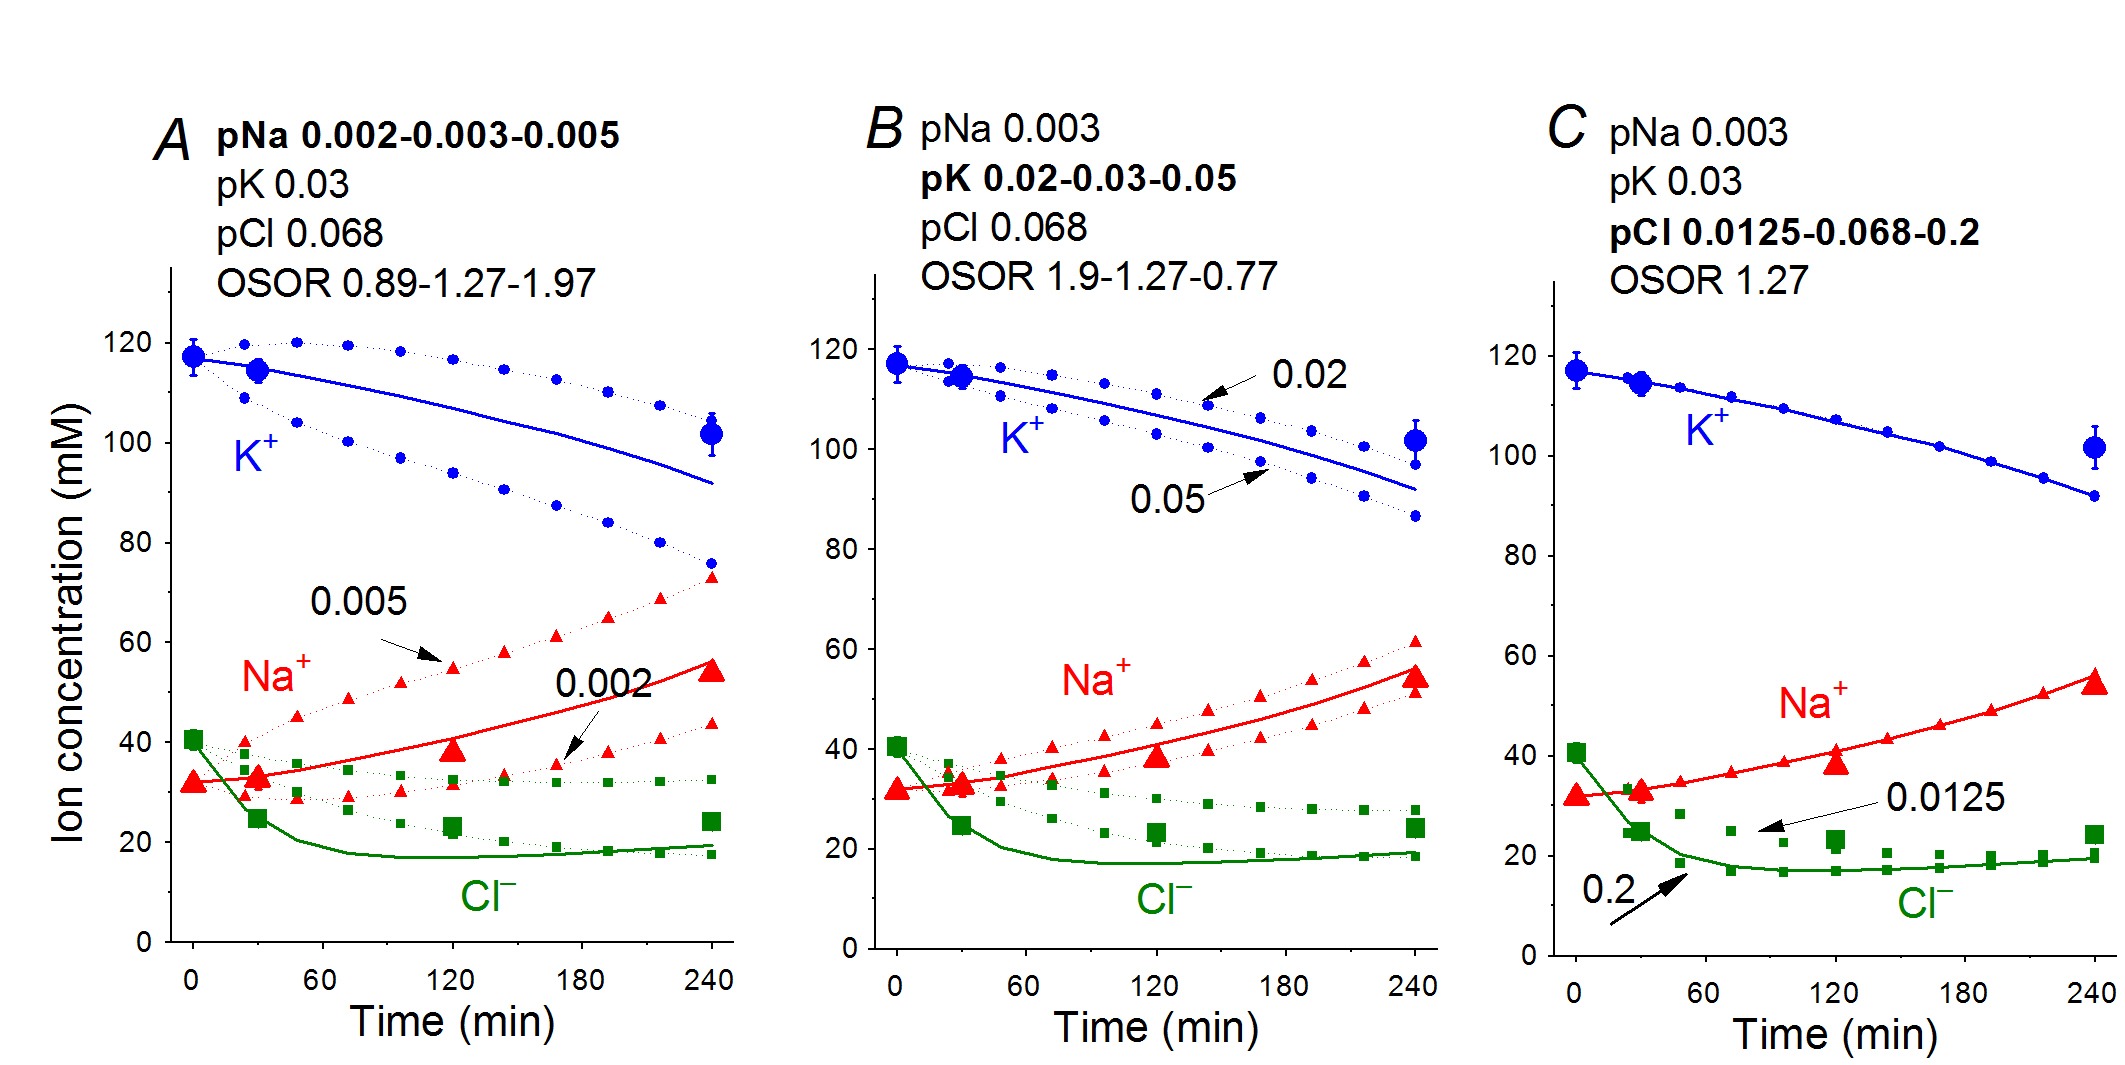
Figure 7. Dependence of the calculated K+, Na+, and Cl- redistribution dynamics during STS-induced apoptosis on K+, Na+, and Cl- channel permeabilities. Experimental data are shown by the large symbols. Solid lines – data calculated for the following parameters: na0 = 140, k0 = 5.8, cl0 = 116, B0 = 48.2, kv = 1, na = 32, k = 117, cl = 40, beta = 0.029, gamma = 1.5, pna = 0.003, pk = 0.03, pcl = 0.068, inc = 3E-6, ikc = inkcc = 0, kb = 0.000068. Dotted lines with small symbols: calculated data for parameter values indicated above the graphs. OSOR values are given for a 4 h time point [10].
It was found that (1) the effects of regulatory volume decrease (RVD) and regulatory volume increase (RVI) on cells placed in anisosmolar media occur under certain conditions without changes in cell membrane properties; (2) RVI-like effects depend on whether the hyperosmolar medium is prepared with NaCl or an uncharged osmolyte like sucrose (data not shown).
Shown in Fig. 8 is a reset of ion homeostasis in cells like U937 in a hypoosmolar medium with external NaCl concentration reduced to 75 mM for a system with different cotransporters and parameters corresponding to U937 cells equilibrated in a standard RPMI medium [12]. Shown in Fig. 9 are transient processes following an increase in the osmolarity of the medium by adding 100 mM NaCl [13]. Partial suppression of RVI by the NKCC cotransporter is also illustrated.
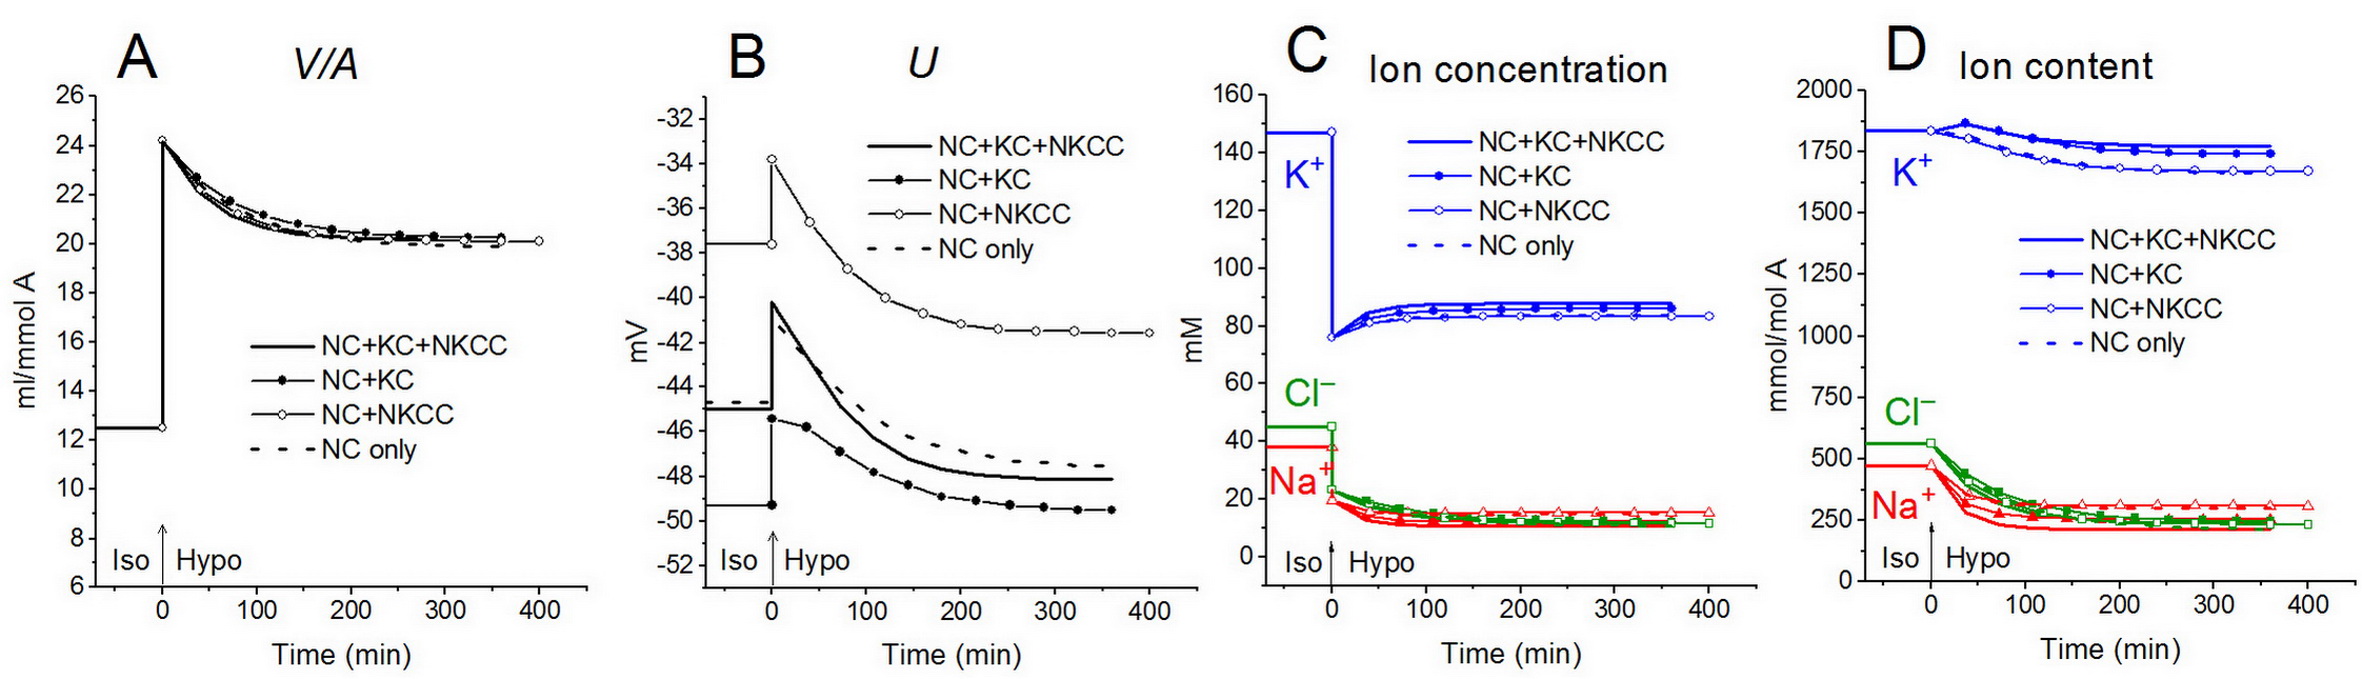
Figure 8. Rearrangement of ionic homeostasis during the Iso-Hypo transition, calculated for a system with different sets of cotransporters and parameters as in normal U937 cells. The arrows at t = 0 show the replacement of a standard medium of 310 mOsm with a hypoosmolar medium of 160 mOsm, which was done by decreasing the NaCl concentration by 75 mM [12].
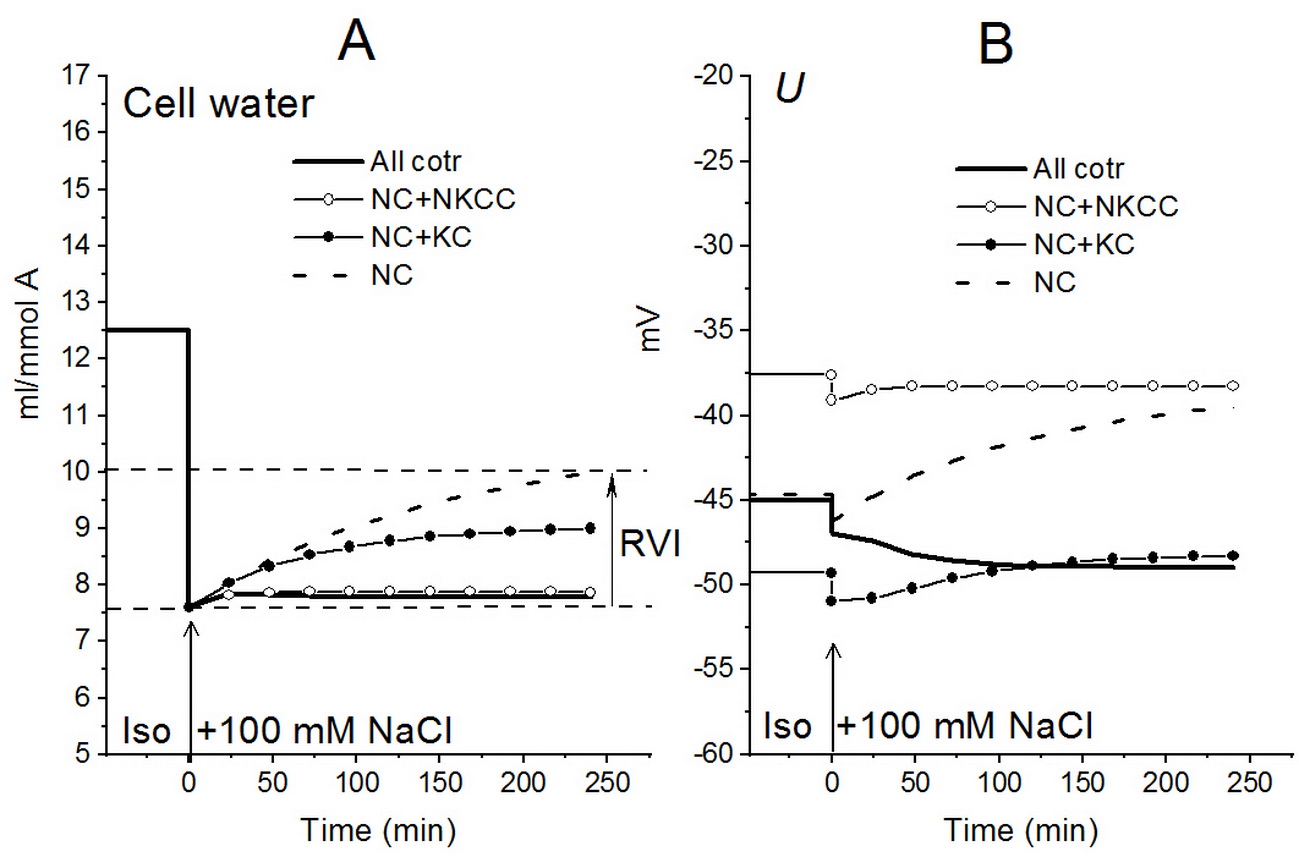
Figure 9. The presence of the NKCC cotransporter in the U937 cell model reduces the RVI effect observed after increasing the osmolarity of the medium by adding 100 mM NaCl. Calculations have been also performed for cell models with parameters as in normal U937 cells and different sets of cotransporters [13].
The response of cells to hyperosmolar stress consists of two types of processes. In addition to RVI, which manifests as an increase of the cell volume, the apoptosis triggered in U937 cells is associated with a delayed decrease of cell volume. This effect is observed in many types of proliferating cells and was considered in our recent article [12].
Due to the time delay between RVI and AVD, they can be observed in the same sample. The transition from RVI to AVD in the cell population manifests itself as a change in the ratio between the number of cells at the RVI and AVD stages. The number of RVI cells decreases over time, and the number of AVD cells increases (Fig. 10A, B, C, M), which indicates that the transition from RVI to AVD in each cell is rapid. Ionic changes underlying RVI and AVD in hyperosmolar media, obtained in K562, Jurkat, and U937 cells in another separate series of experiments are presented in [13-15].
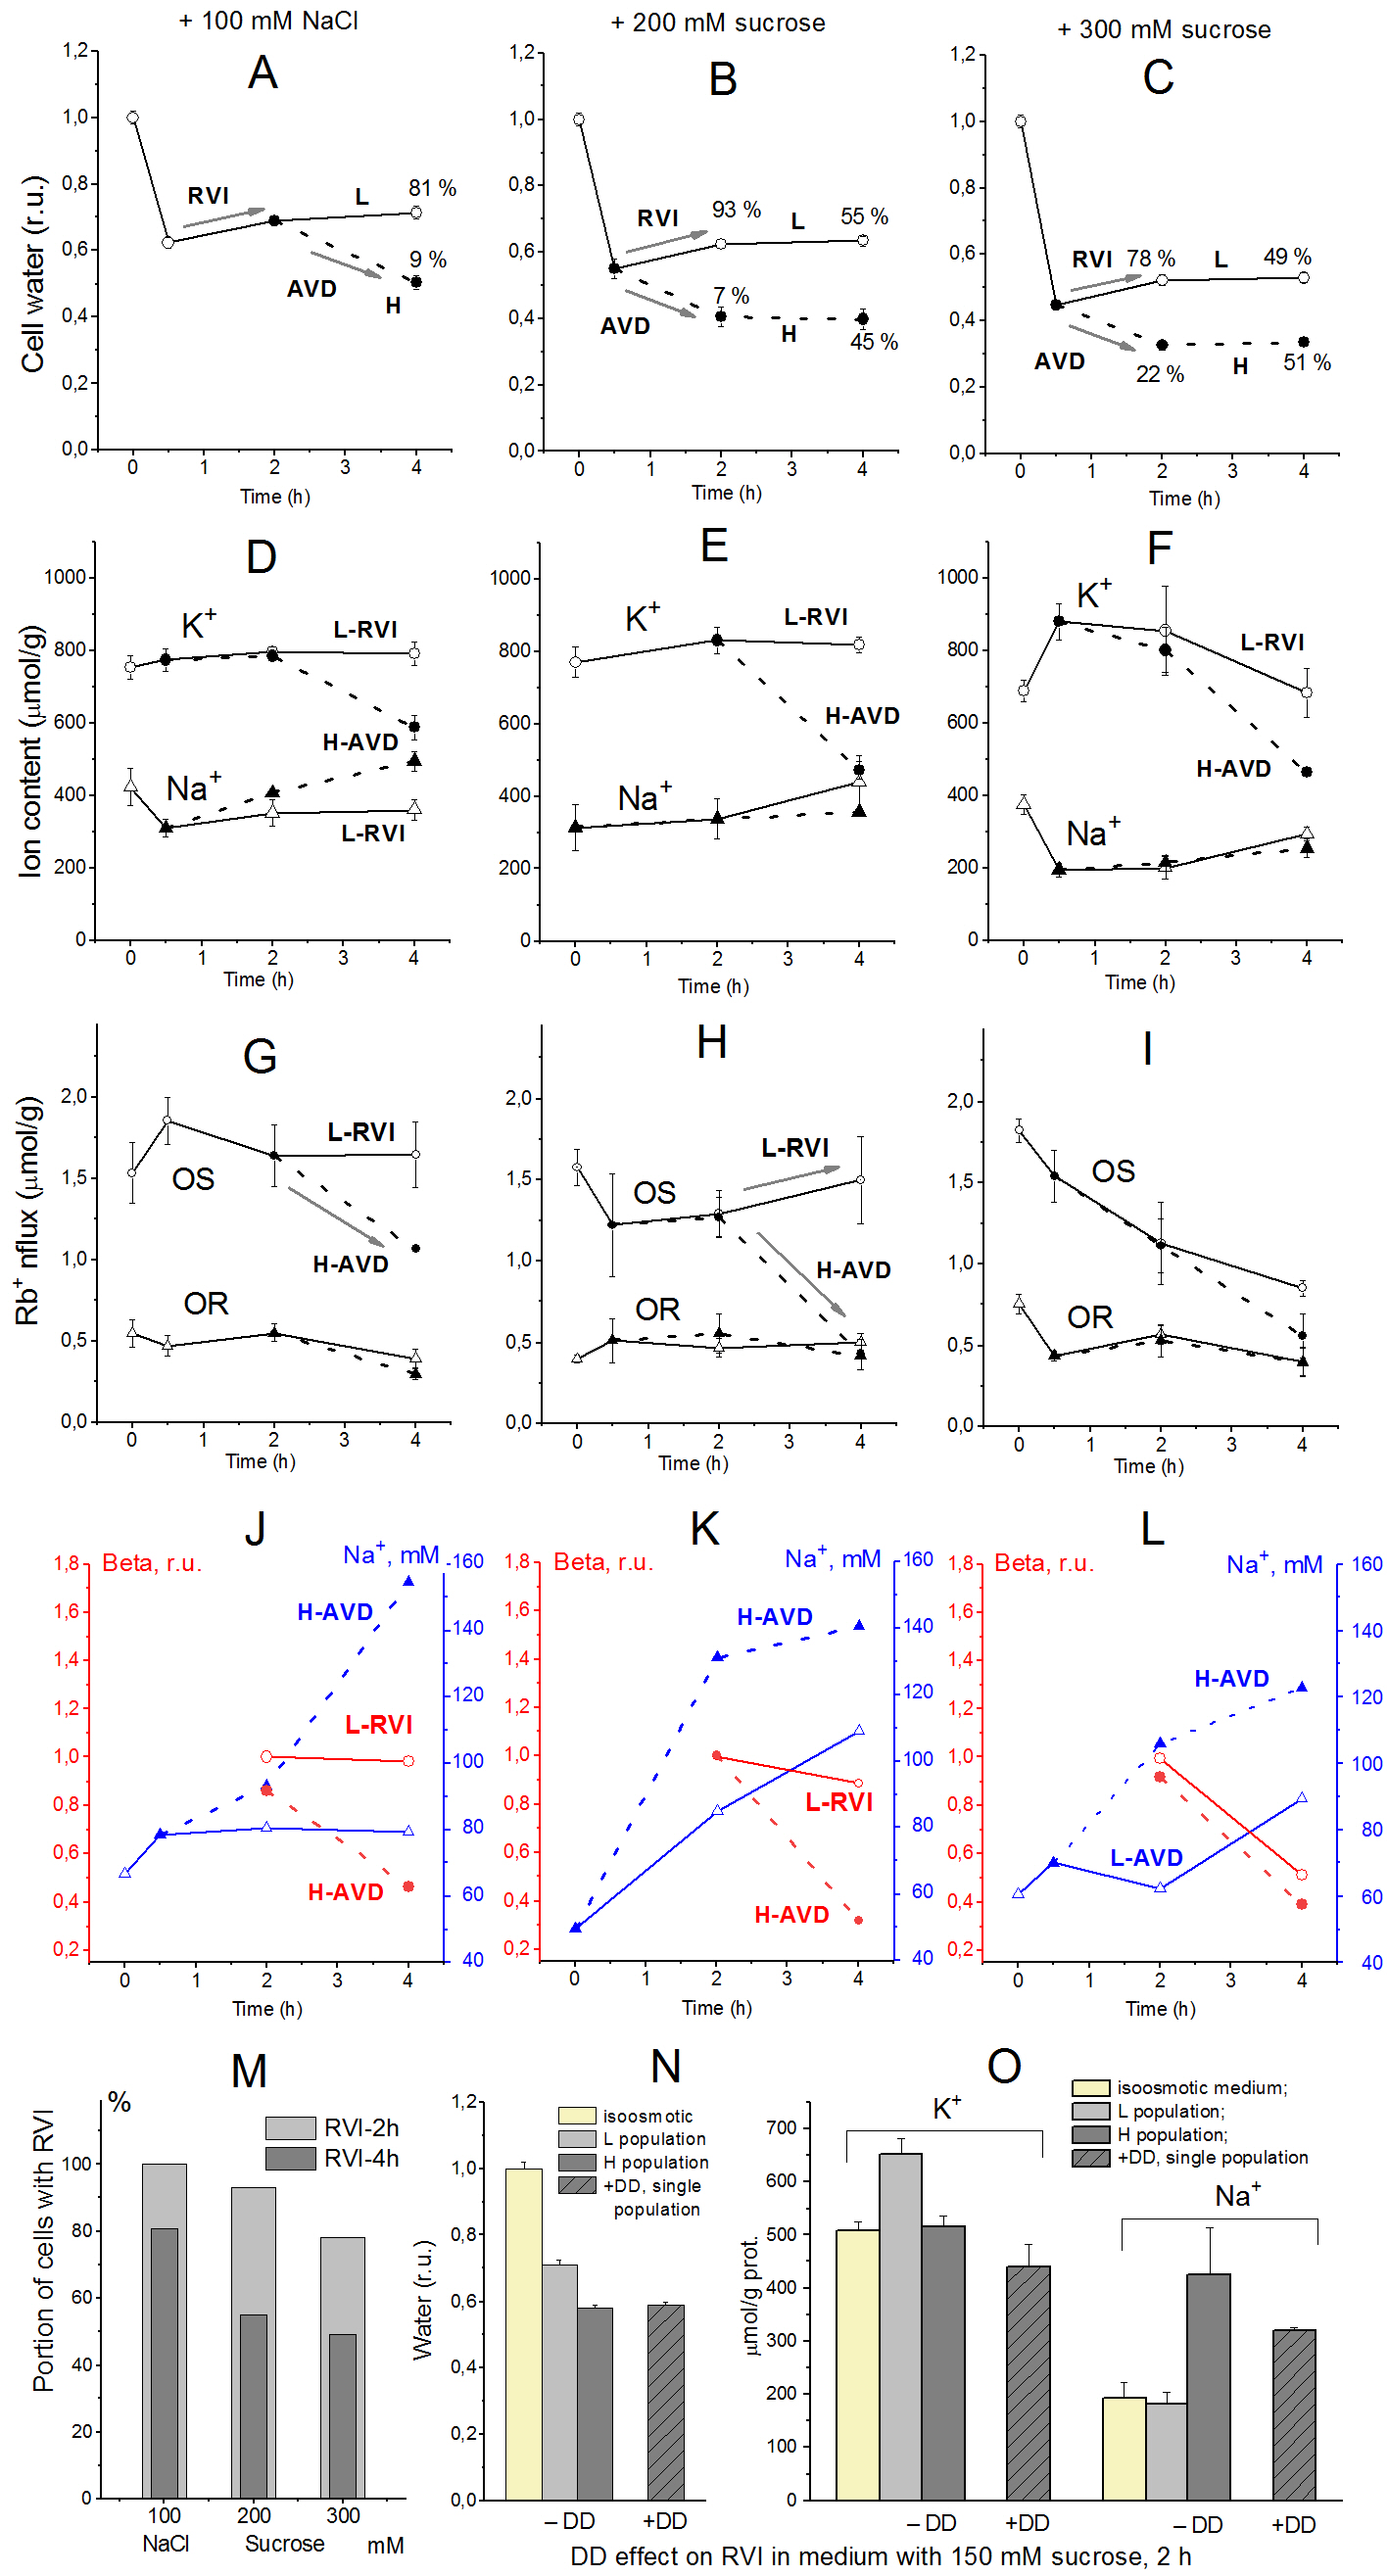
Figure 10. Bifurcation of U937 cell populations in hyperosmolar medium [13]. The light subpopulation (L) that predominates initially represents cells undergoing RVI, while the heavy subpopulation (H) shows a decrease in volume during apoptosis, or AVD. (A–C) cell water content, (D–F) intracellular K+, Na+ content, (G–I) ouabain-sensitive (OS) and–resistant (OR) Rb+ influxes, (J–L) Na+ concentrations and beta, (M) the percentage of cells with RVI (fraction L) after 2-h and 4-h incubation in a hyperosmolar medium assessed by protein, (N, O) DMA + DIDS (DD) effect on RVI in hyperosmolar medium with 150 mM sucrose. Data at t = 0 represent cells in normal RPMI medium. Mean ± SEM values were calculated from at least three independent experiments. (N, O) DMA (0.05 mM) and DIDS (0.5 mM) were added simultaneously with addition of 150 mM sucrose.
In the case of cells like U937, when the minimum of experimental data required for calculations is available, our results show that RVI in a sucrose-containing hyperosmolar medium is possible only due to an increase in the coefficient inc. In this case, RVI is associated with an increase in the intracellular content of Na+ and Cl- and a slight change in the content of K+. It is these changes in Na+ and K+ that were observed in the subpopulation of U937 cells exhibiting RVI in a hyperosmolar medium with 200 mM sucrose. The key role of the NC cotransporter in RVI has been independently verified by blocking RVI with a combination of dimethylamiloride, a known Na+/H+exchange inhibitor, and DIDS, an inhibitor of the Cl-/HCO3-exchange (Fig. 10N, O).
According to our calculations, RVI in a NaCl-containing hyperosmolar medium can occur automatically, without a change in the transport parameters; it only requires NC or NC+KC cotransporters, but not NKCC. Hyperosmolarity-induced increase in inc, a decrease in ikc, inkcc, and pCl, or an increase in the permeability of HICC channels (non-selective Hypertonicity-Induced Cation Channels) are sufficient to stimulate RVI. In all these cases, RVI is associated with an increase in the total content of K+ and Na+, but the relative changes in K+ and Na+ contents depend on which parameters change [13]. In an NaCl-containing hyperosmolar medium, U937 cells show small RVI and insignificant changes in the content of K+ and Na+; however, the available data obtained on living cells are insufficient to further elucidate the mechanism of RVI in these cases.
The AVD response displayed by heavy subpopulations of U937 cells incubated in a sucrose-containing hyperosmolar medium is slightly stronger than in an NaCl-containing medium of the same osmolarity. In both cases, AVD is associated with a significant decrease in the K+ content of cells, while the Na+ content increases only in hyperosmotic NaCl medium (Fig. 10D, E, F). The loss of K+ and gain of Na+ during AVD in different hyperosmolar media are consistent with the predictions of the model. It had been shown earlier that a decrease in ouabain-sensitive Rb+ (K+) influx resulting from a decrease in the pumping rate beta plays an important role in the AVD induced in U937 cells by staurosporine [10, 11]. AVD in U937 cells treated with hyperosmolar media in the previously described experiments is also associated with a decline in the pump-mediated Rb+ influx due to changes in beta, i.e., in intrinsic pump properties (Fig. 10G - L). No significant changes in ouabain-sensitive Rb+ influx and the pump rate coefficient were observed in the light subpopulations of cells exposed either to NaCl or sucrose hyperosmolar media, which is characteristic of the RVI response.
Calculation of the balance of monovalent ions fluxes through the cell membrane is indispensable for understanding of the workings of the entire cell electrochemical system and provides insight into the basic functions of the cell.
The executable file of the BEZ02BC program for calculating the fluxes of monovalent ions through the cell membrane, as well as a User Guide can be found as Supplementary Material in [12-14]. A version adapted to display graphics is available at https://vereninov.com/cellionfluxes.
Human histiocytic lymphoma U937 cells were obtained from the shared research facility “Vertebrate cell culture collection” supported by the Ministry of Science and Higher Education of the Russian Federation (Agreement № 075-15-2021-683). The authors are grateful to Dr. M. Model (Department of Biological Sciences, Kent State University, Kent, Ohio 44242, USA) and Dr. I. Marakhova (Institute of Cytology, Russian Academy of Sciences, St-Petersburg, Russia) for helpful discussions and insightful comments. We thank Dr. Vereninov I.A. Jr. and students of the Peter the Great St-Petersburg Polytechnic University (St-Petersburg, Russia) for developing a website with a new version of the program.
Author contributions
AV wrote the manuscript with input from all authors. All authors contributed to the article, approved the submitted version of the manuscript and agreed to be accountable for all aspects of the work.
Funding SourcesThis research was funded by a grant from the Ministry of Science and Higher Education of the Russian Federation (Agreement № 075-15-2021-1075, signed 28 September 2021, local identifier 415/21–23).
The authors have no conflicts of interest to declare.